About last night… (and about the Leafs holding leads)

By Cam Charron
10 years ago
“Score effects” is the term used by hockey analysts to explain why teams that are behind by a goal tend to out-shoot the opposition. You may notice in the third period, often a team will rally but come up just shy. I’ll point to examples last night, such as Carolina, leading 4-1 into the third period against New Jersey, were out-shot 9-3 and held on for a 4-3 win. Winnipeg, up 3-1, were out-shot 10-7 and won 3-2. Phoenix was up 2-0, was out-shot 14-11 and won 3-1.
Not to say this happens every game, but comebacks happen. We don’t know why, but in almost any sport, the trailing team generates some artificial momentum and does better.
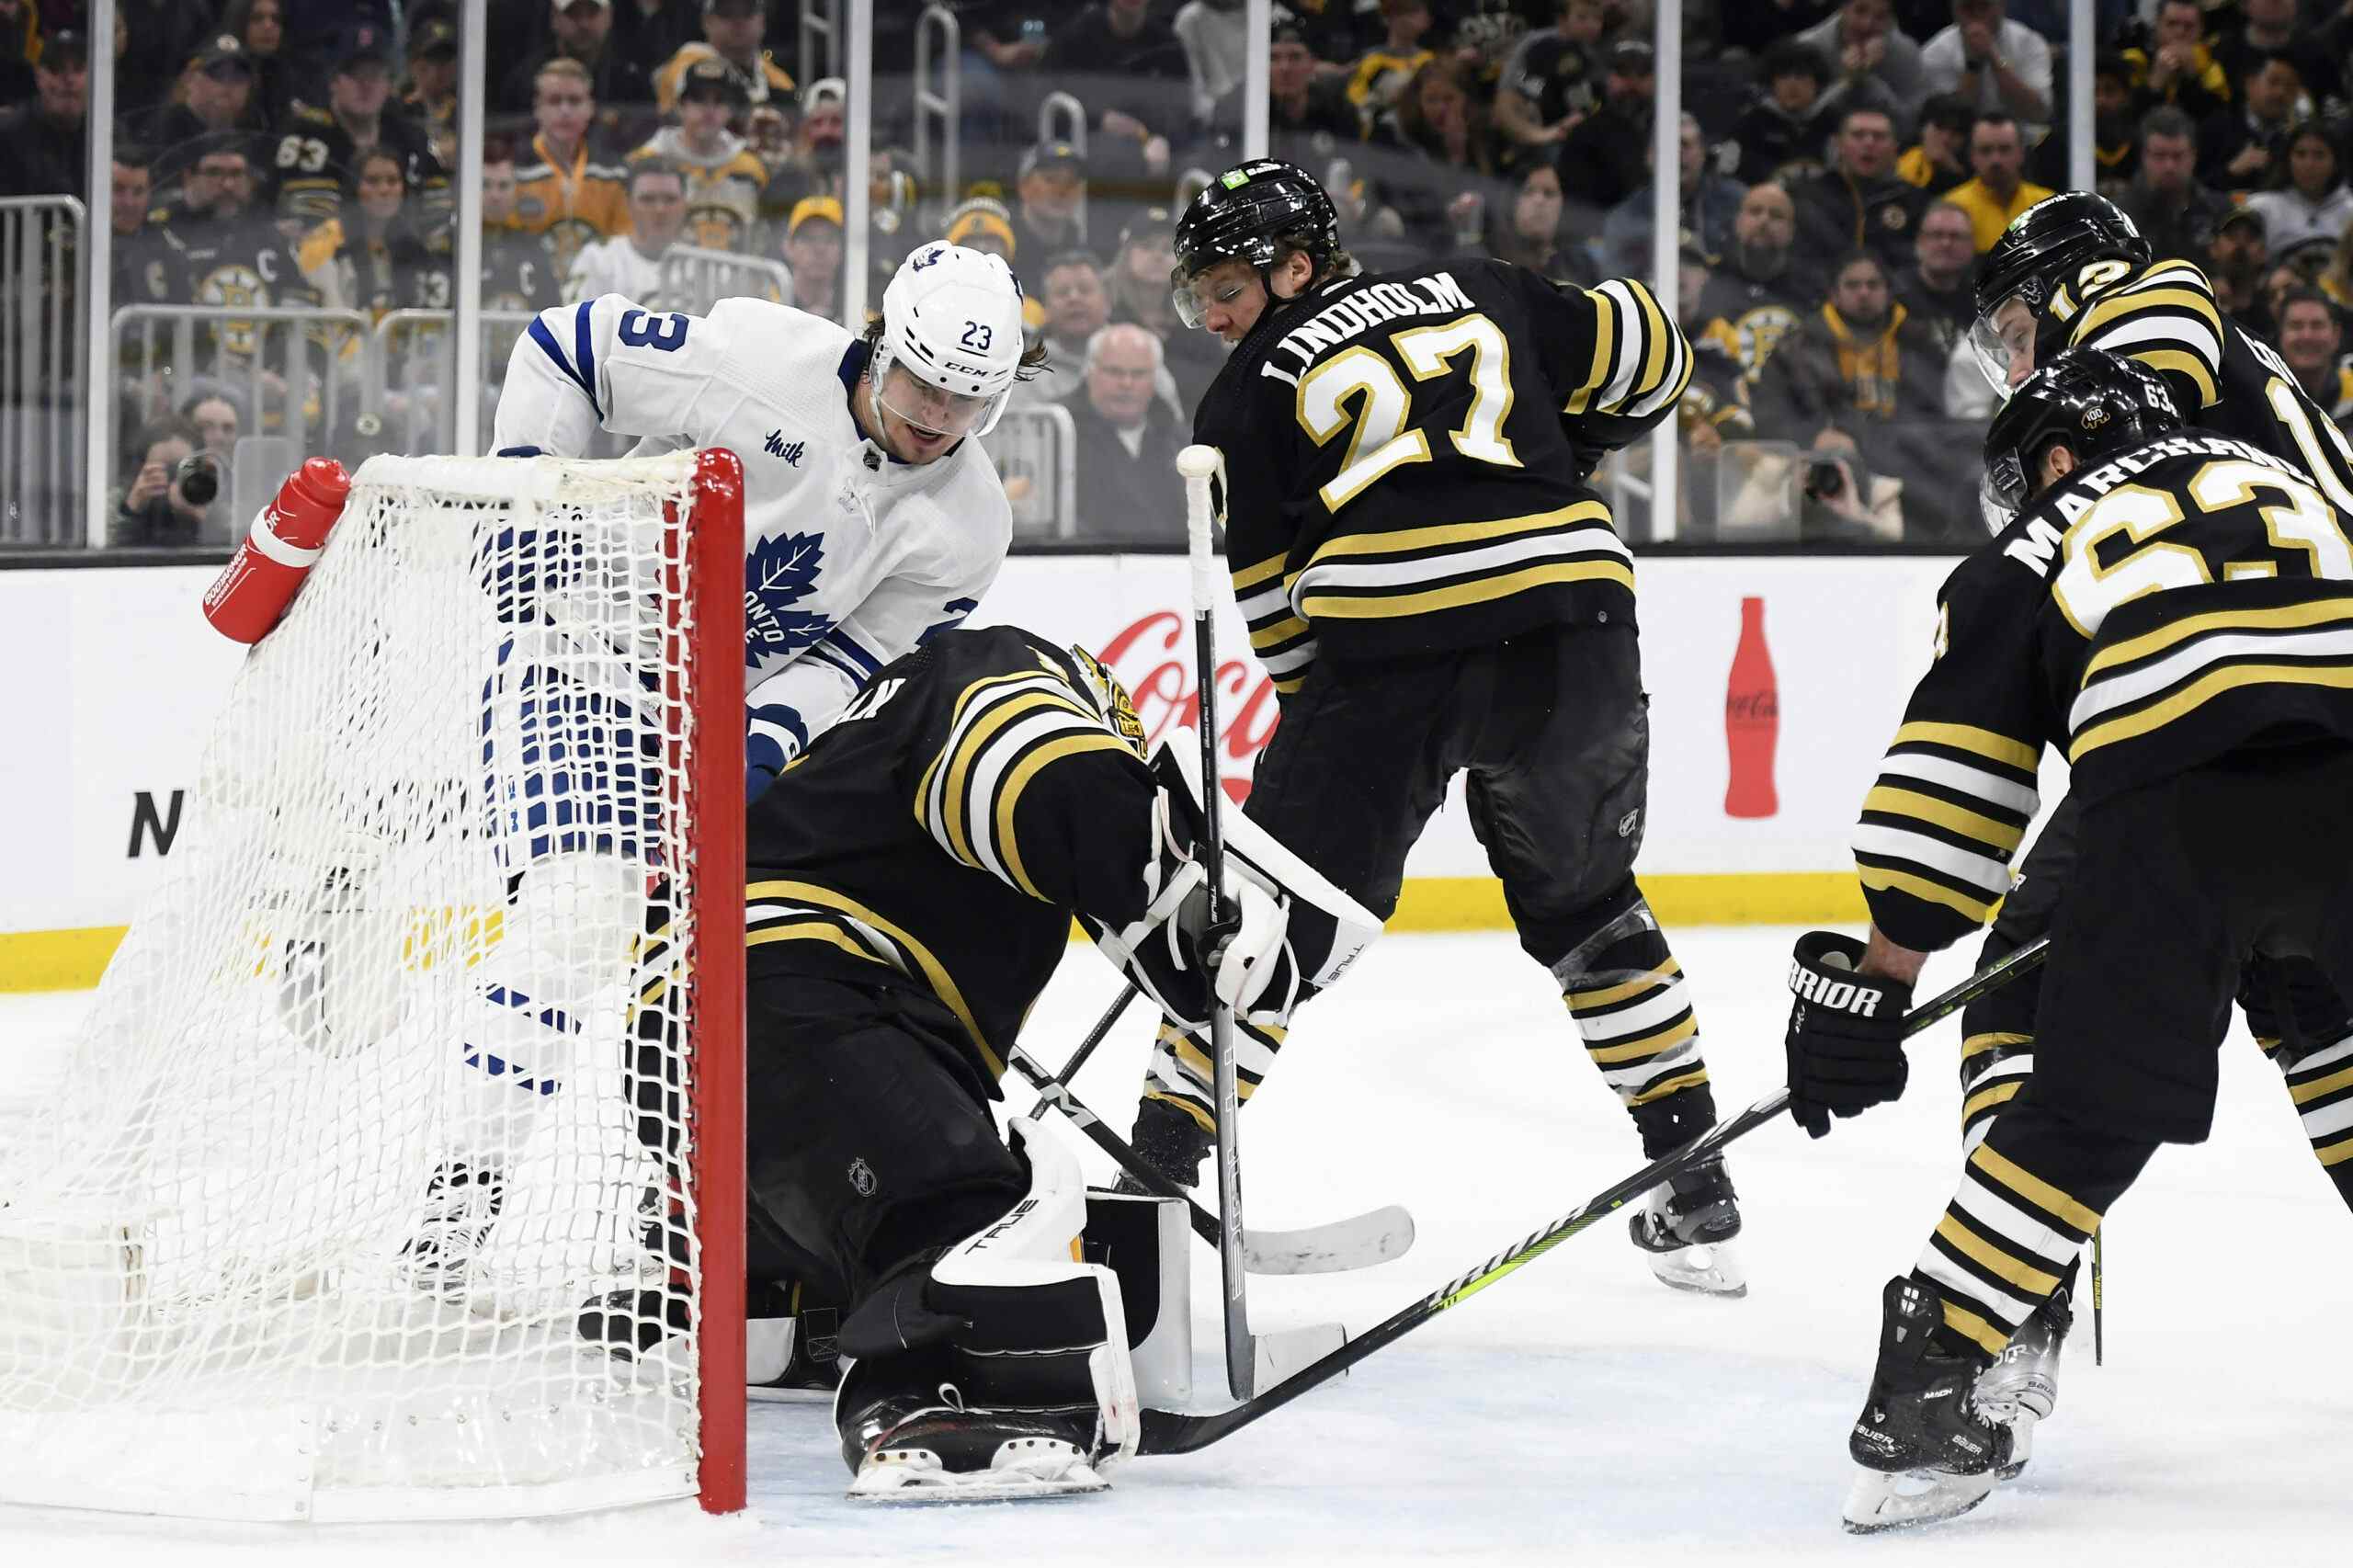
That doesn’t explain what’s up with the Toronto Maple Leafs when they attempt to hold a lead. Nevermind getting out-shot 19-0 by the Penguins in the third period and overtime after being up 5-3 going into the final 20, the last time the Leafs held a lead going into the third, against the Islanders, they were out-shot 17-10. (I incorrectly wrote that the Leafs had been out-shot 36-4 in third periods their last two times going in with leads in a comment on the postgame thread. It’s really 36-10. Misread something).
I don’t want to re-hash too much what happened against Pittsburgh, but I want to point you to this chart here. We know that the Maple Leafs are a sub-50% puck-possession team. This is measured by Corsi, a metric that tracks every attempted shot at either end. 50% is even, and so on.
This is breaking down last season’s statistics. I looked at the NHL median for each 5-on-5 game state (tied, up by 1 goal, up by 2 goals, etc:) and noticed something fishy:
| NHL Median | Leafs % | Leafs Rank | Diff | |
|---|---|---|---|---|
| Up 2 | 43.0% | 38.1% | 26th | -4.9% |
| Up 1 | 45.8% | 40.5% | 27th | -5.3% |
| Tied | 49.7% | 43.8% | 29th | -5.9% |
| Down 1 | 53.5% | 50.6% | 25th | -2.9% |
| Down 2 | 56.7% | 54.9% | 26th | -1.8% |
(Numbers via Hockey Analysis — Note how the NHL median Corsi % increases as you subtract a goal from the net total. The average team does better Down 1 than Tied, for instance)
In the Up 2, Up 1 and Tied game states, the Leafs are much further away from the median, between 4.9% and 5.9%, compared to 1.8% and 2.9% when they’re down by 1. This could be coincidental, but a similar discrepancy comes this season:
| NHL Median | Leafs % | Leafs Rank | Diff | |
|---|---|---|---|---|
| Up 2 | 44.9% | 37.2% | 27th | -7.7% |
| Up 1 | 47.1% | 40.3% | 28th | -6.8% |
| Tied | 49.6% | 41.9% | 28th | -7.7% |
| Down 1 | 53.1% | 51.5% | 21st | -1.6% |
| Down 2 | 53.0% | 43.0% | 30th | -10.0% |
(Keep in mind, the Leafs haven’t played a lot of minutes down by two goals, and when they have, it’s been against Chicago, Vancouver, Boston… some pretty good puck-possession teams. And also Columbus)
I want to concentrate on that “Down 1”. The Leafs are much, much closer to the NHL median when they’re down by 1 than when they’re Tied or Up by a goal. Tyler Dellow at Sportsnet also noticed this trend when looking at individual Corsi rates for Dion Phaneuf, in a post well worth your time:
His Corsi% when tied and leading has, however, absolutely collapsed relative to this group of players. That’s going to lead to fewer shots when he’s on the ice and fewer points—and we’ve seen from his numbers that that’s the case.…First, perhaps Phaneuf has experienced some sort of a decline that affects him only when the Leafs are leading or tied. Second, it’s possible that the Leafs have changed the way they play when they’re leading or tied, and that has disproportionately affected Phaneuf.
Why are the Leafs 5-7 percentage points below league median when leading or tied, but are much, much closer to the median when they’re behind? There has to be some strategy at play here, something that Randy Carlyle is doing that’s hindering the Leafs ability to generate and prevent shots. I’m no scout, but it doesn’t take a genius to note that there are some real problems with the breakout, and that Leaf goals are created almost exclusively off of counter-attacks. Against Pittsburgh, the Leafs scored their goals in each instance within seconds of recovering the puck off a Penguin player’s stick.
That only really works when you’re getting great goaltending. Leafs goaltending has really yet to falter this season, but to paraphrase Jonathan Willis from Bleacher Report, both James Reimer and Jonathan Bernier are getting numbers similar to Dominik Hasek in his prime, and barely flirting with 500 in the last 17 games.
If the goaltending holds up, great, but there exists a solid discrepancy between how the Leafs play when tied and when down by 1. If they had the same 2% difference compared to the median when tied, rather than 7, that’s about 12 fewer shot attempts per game that the goaltenders have to face, and 6-7 fewer actual shots. I don’t know what it is, but somebody’s going to have to figure it out soon, because leads are suddenly coming back to cost the Leafs a little bit more.
And now to look at the Pittsburgh game again
Now… about the Pittsburgh game. Here’s the Fenwick Chart, noting unblocked shots over the course of the game:

It’s actually pretty close. The Penguins held just a two shot advantage going into the third period and OT, where they went up 29-3. The bad call on Jerred Smithson led to a powerplay goal against and Evgeni Malkin got away with shoving Jonathan Bernier into the net, but I don’t think that the Leafs really deserved to hang on in this one. As ugly as the Penguins played in the first and early second, it was reversible. There were some bad giveaways, but ultimately possession trumps all that, and the Penguins came in wave after wave against Jonathan Bernier, who played great.
Some notes, because I didn’t have any in the post-game thread. Numbers via Extra Skater’s game sheet:
- Nazem Kadri started six shifts in the offensive zone and zero in the defensive zone, yet the Leafs were out-shot 4-13 with him on the ice and out-attempted 13-22.
- Kadri played a lot against Evgeni Malkin, but Malkin was surprisingly one of the worst Penguins by way of puck possession on Wednesday. The Penguins out-attempted Toronto 23-19 with Malkin on the ice. He was mostly matched up against Morgan Rielly and Paul Ranger, and those two were the only regular Leafs over 40%.
- I found that pretty interesting, but Rielly-Ranger weren’t really trusted by Carlyle to start shifts. The Leafs had to take 24 shifts in the defensive zone, and while Dion Phaneuf started 14 and Carl Gunnarsson 13, Rielly had 3 and Ranger 4.
- Jerred Smithson had 5, somewhat surprising given his role usually, but he wasn’t having a great night in the circle, at just 4-for-10. The Leafs didn’t record a single shot on goal in the 9.2 minutes Smithson played.
Ultimately, this is a game that the Leafs are going to want to burn, but the problems regarding holding a lead persist. This is somewhat in response to a commenter in the postgame pointing out that there’s no real empirical proof that this is Carlyle’s system at work, and instead a problem of roster composition.
I’d agree, I don’t think the numbers I have are a strong-enough argument, but it’s worth asking why the bulk of Leafs possession troubles seem to occur when the score is tied or when the Leafs are leading. If the answer turns out to be “luck” and by March, these numbers sync up, then at least we didn’t say we didn’t ask the question.
Recent articles from Cam Charron