Examining Patrick Marleau in the place of Zach Hyman

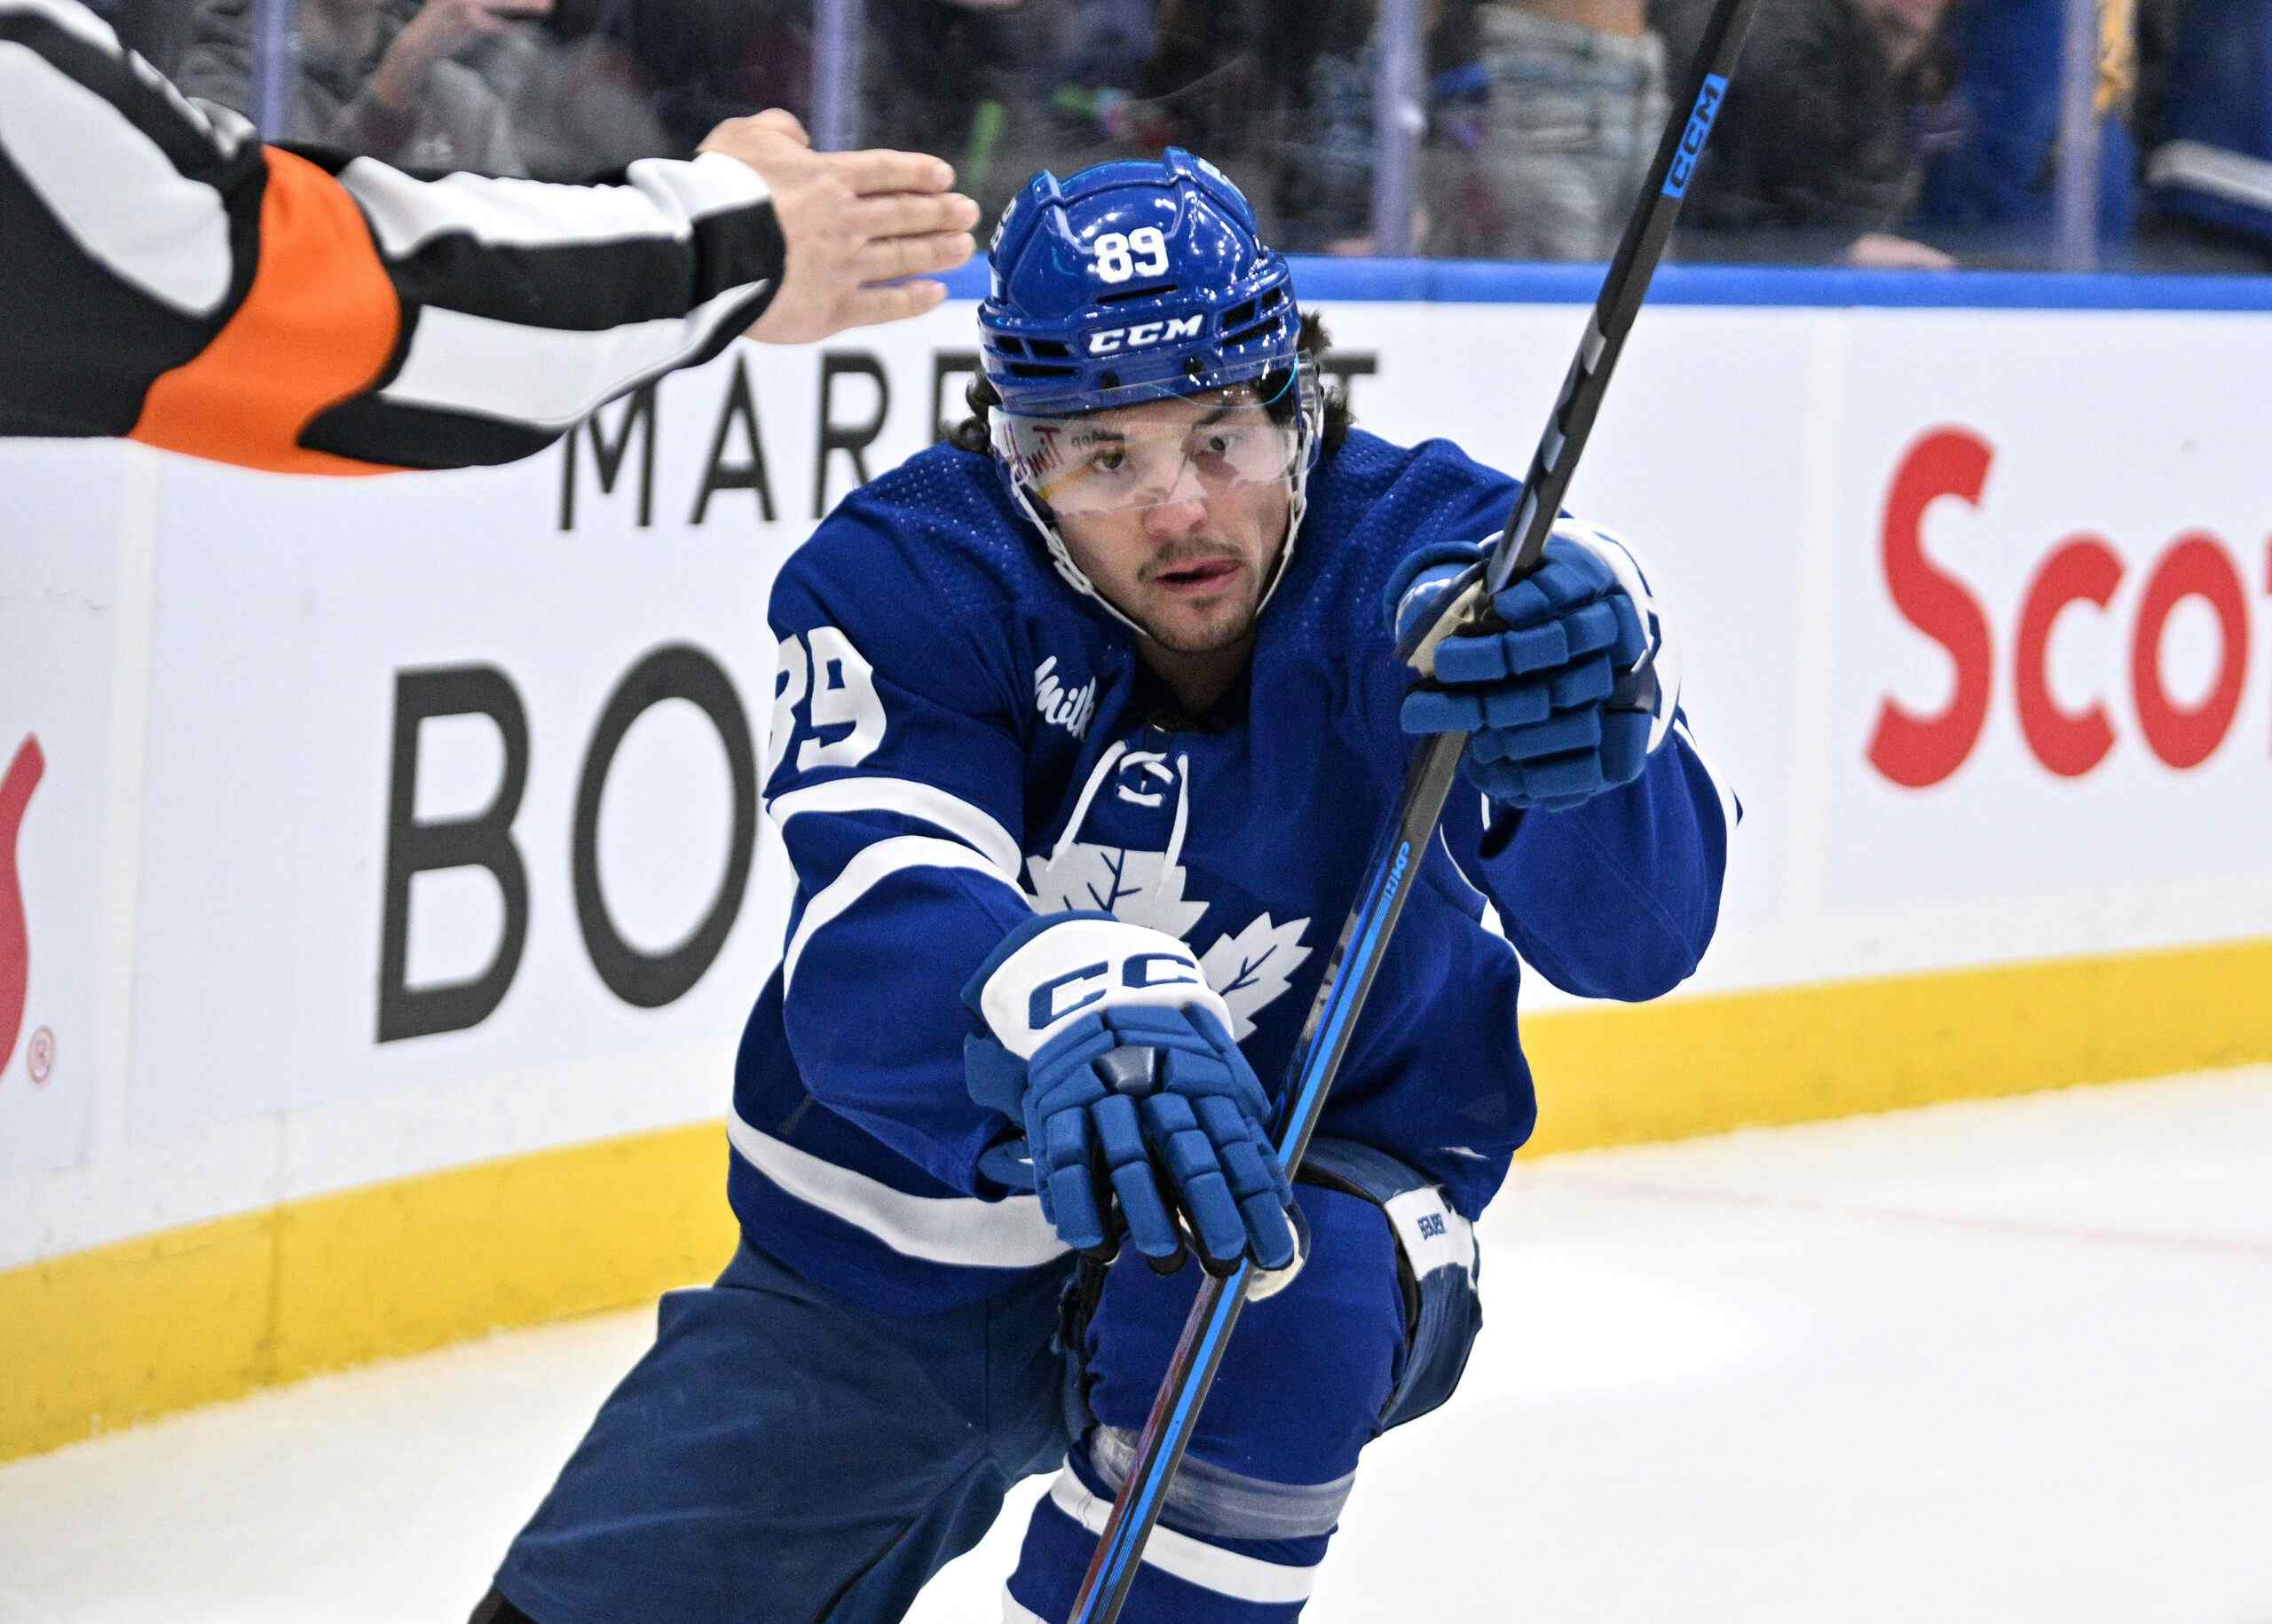
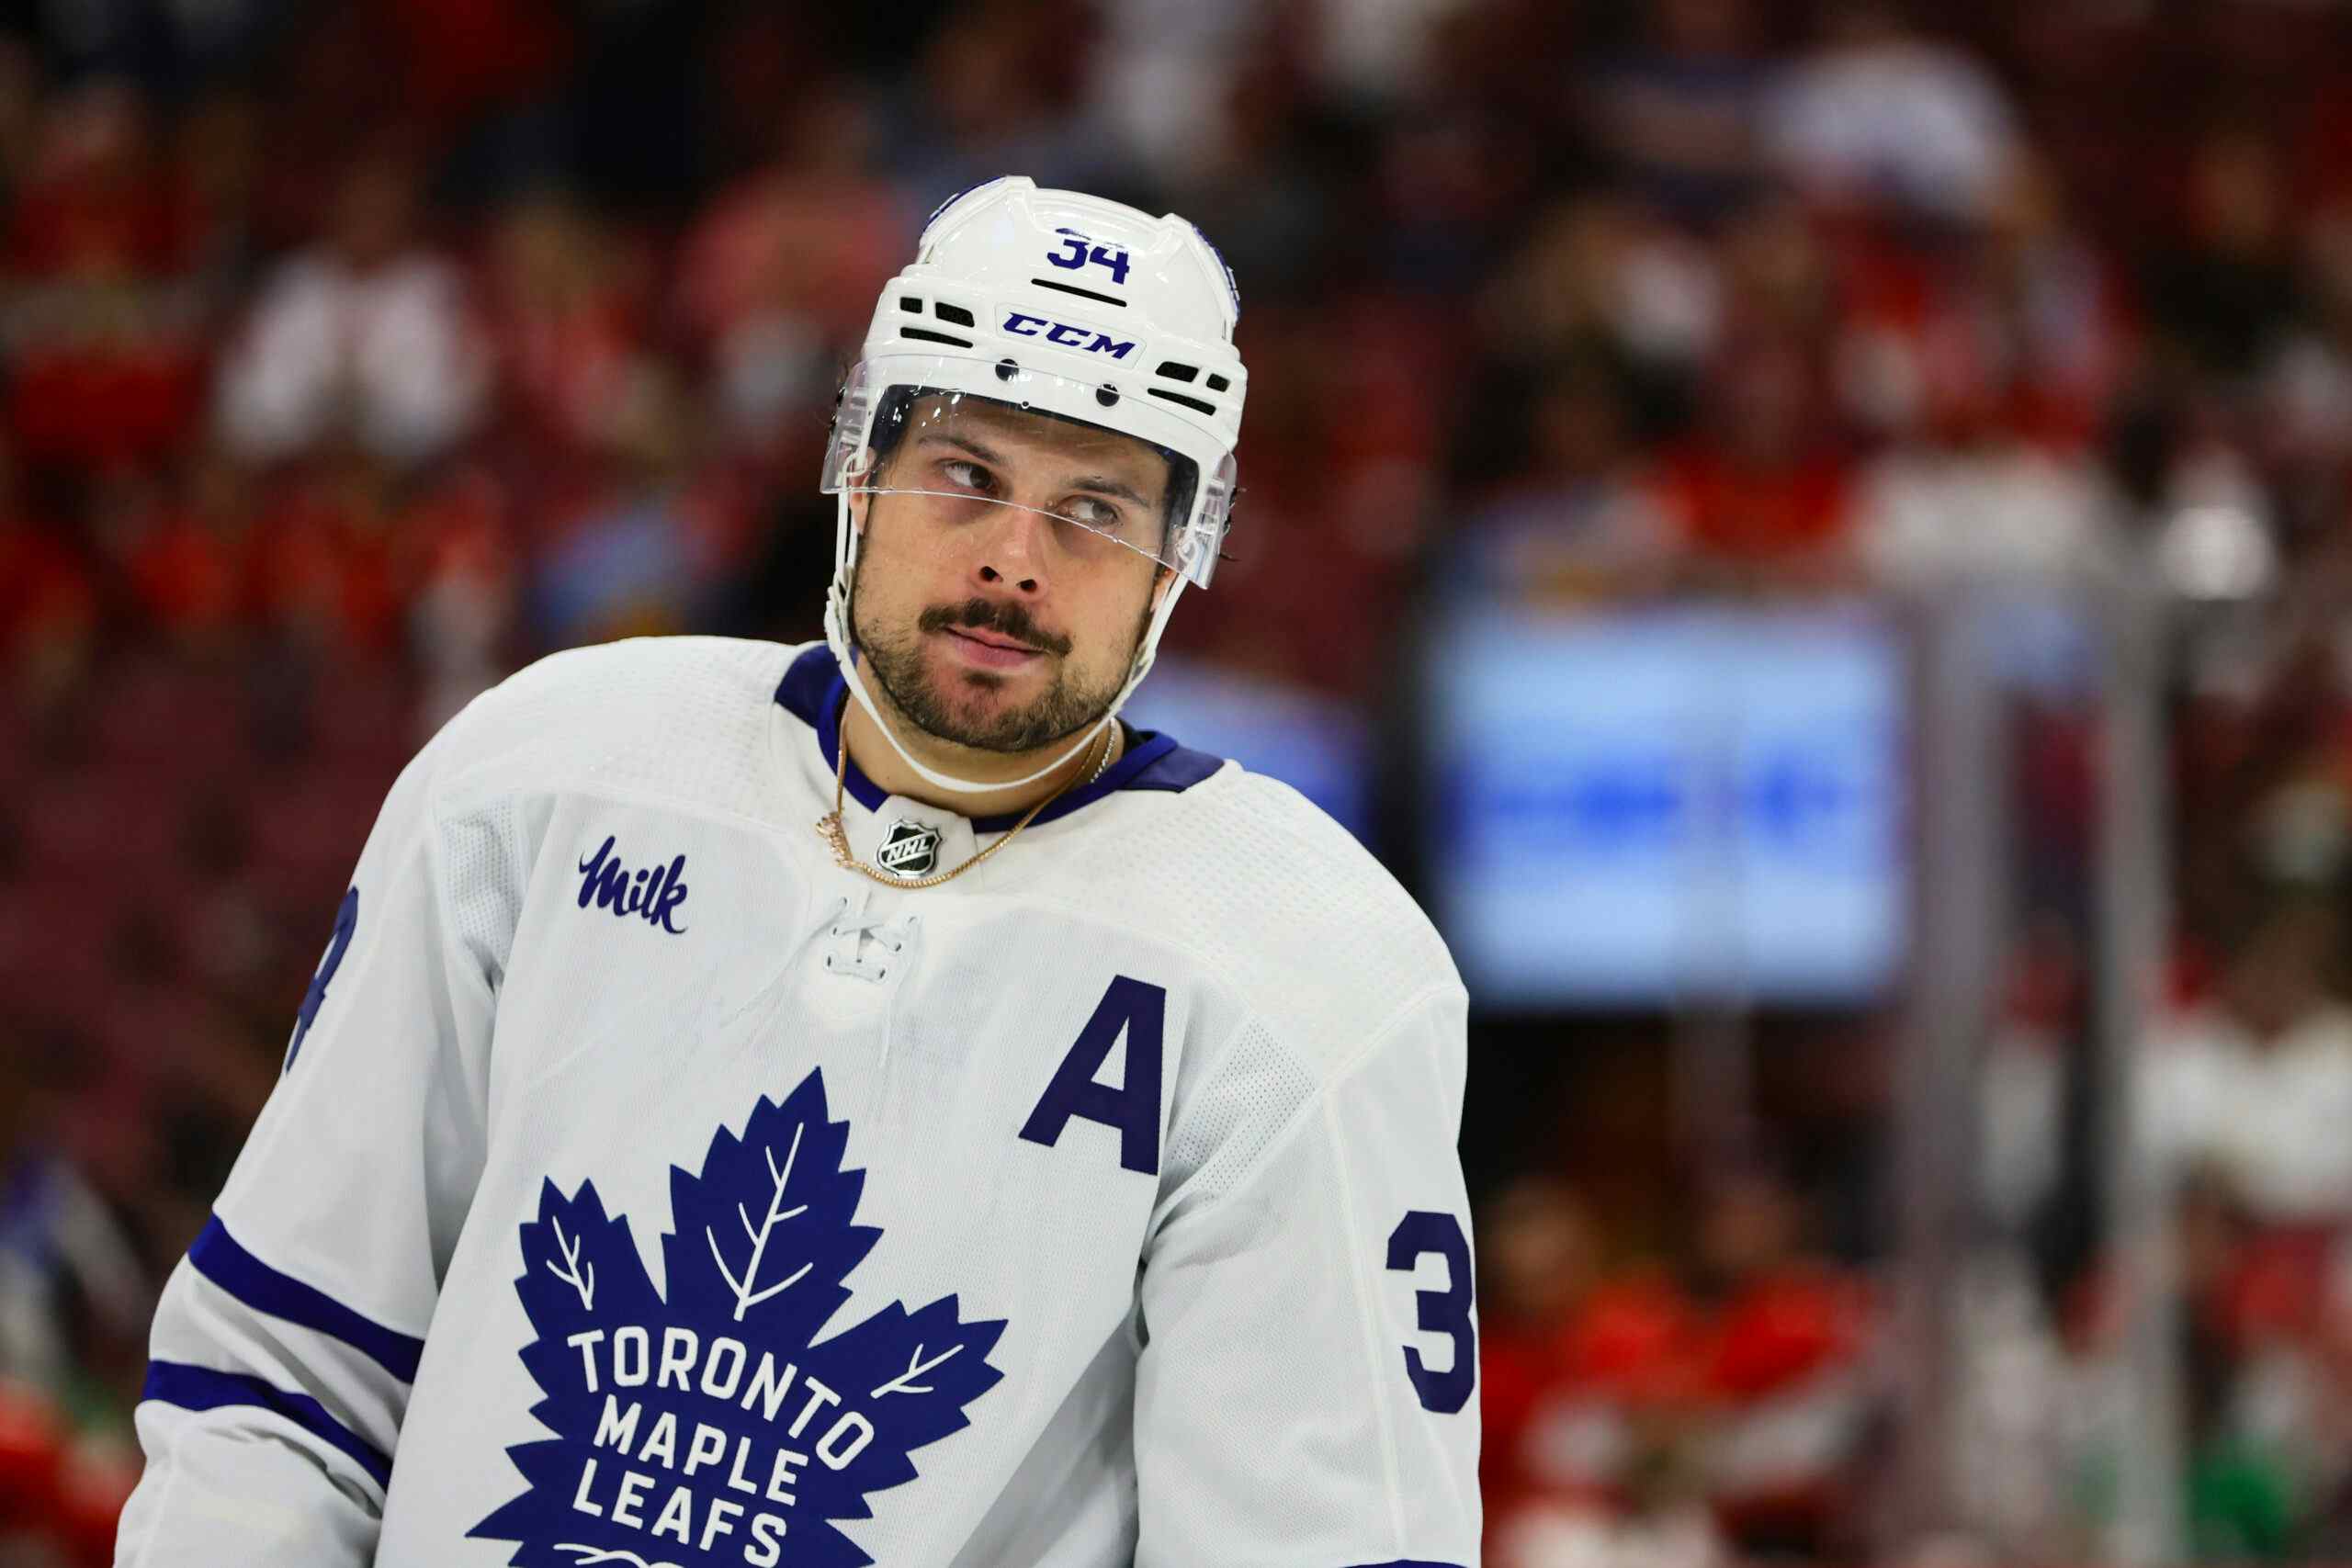
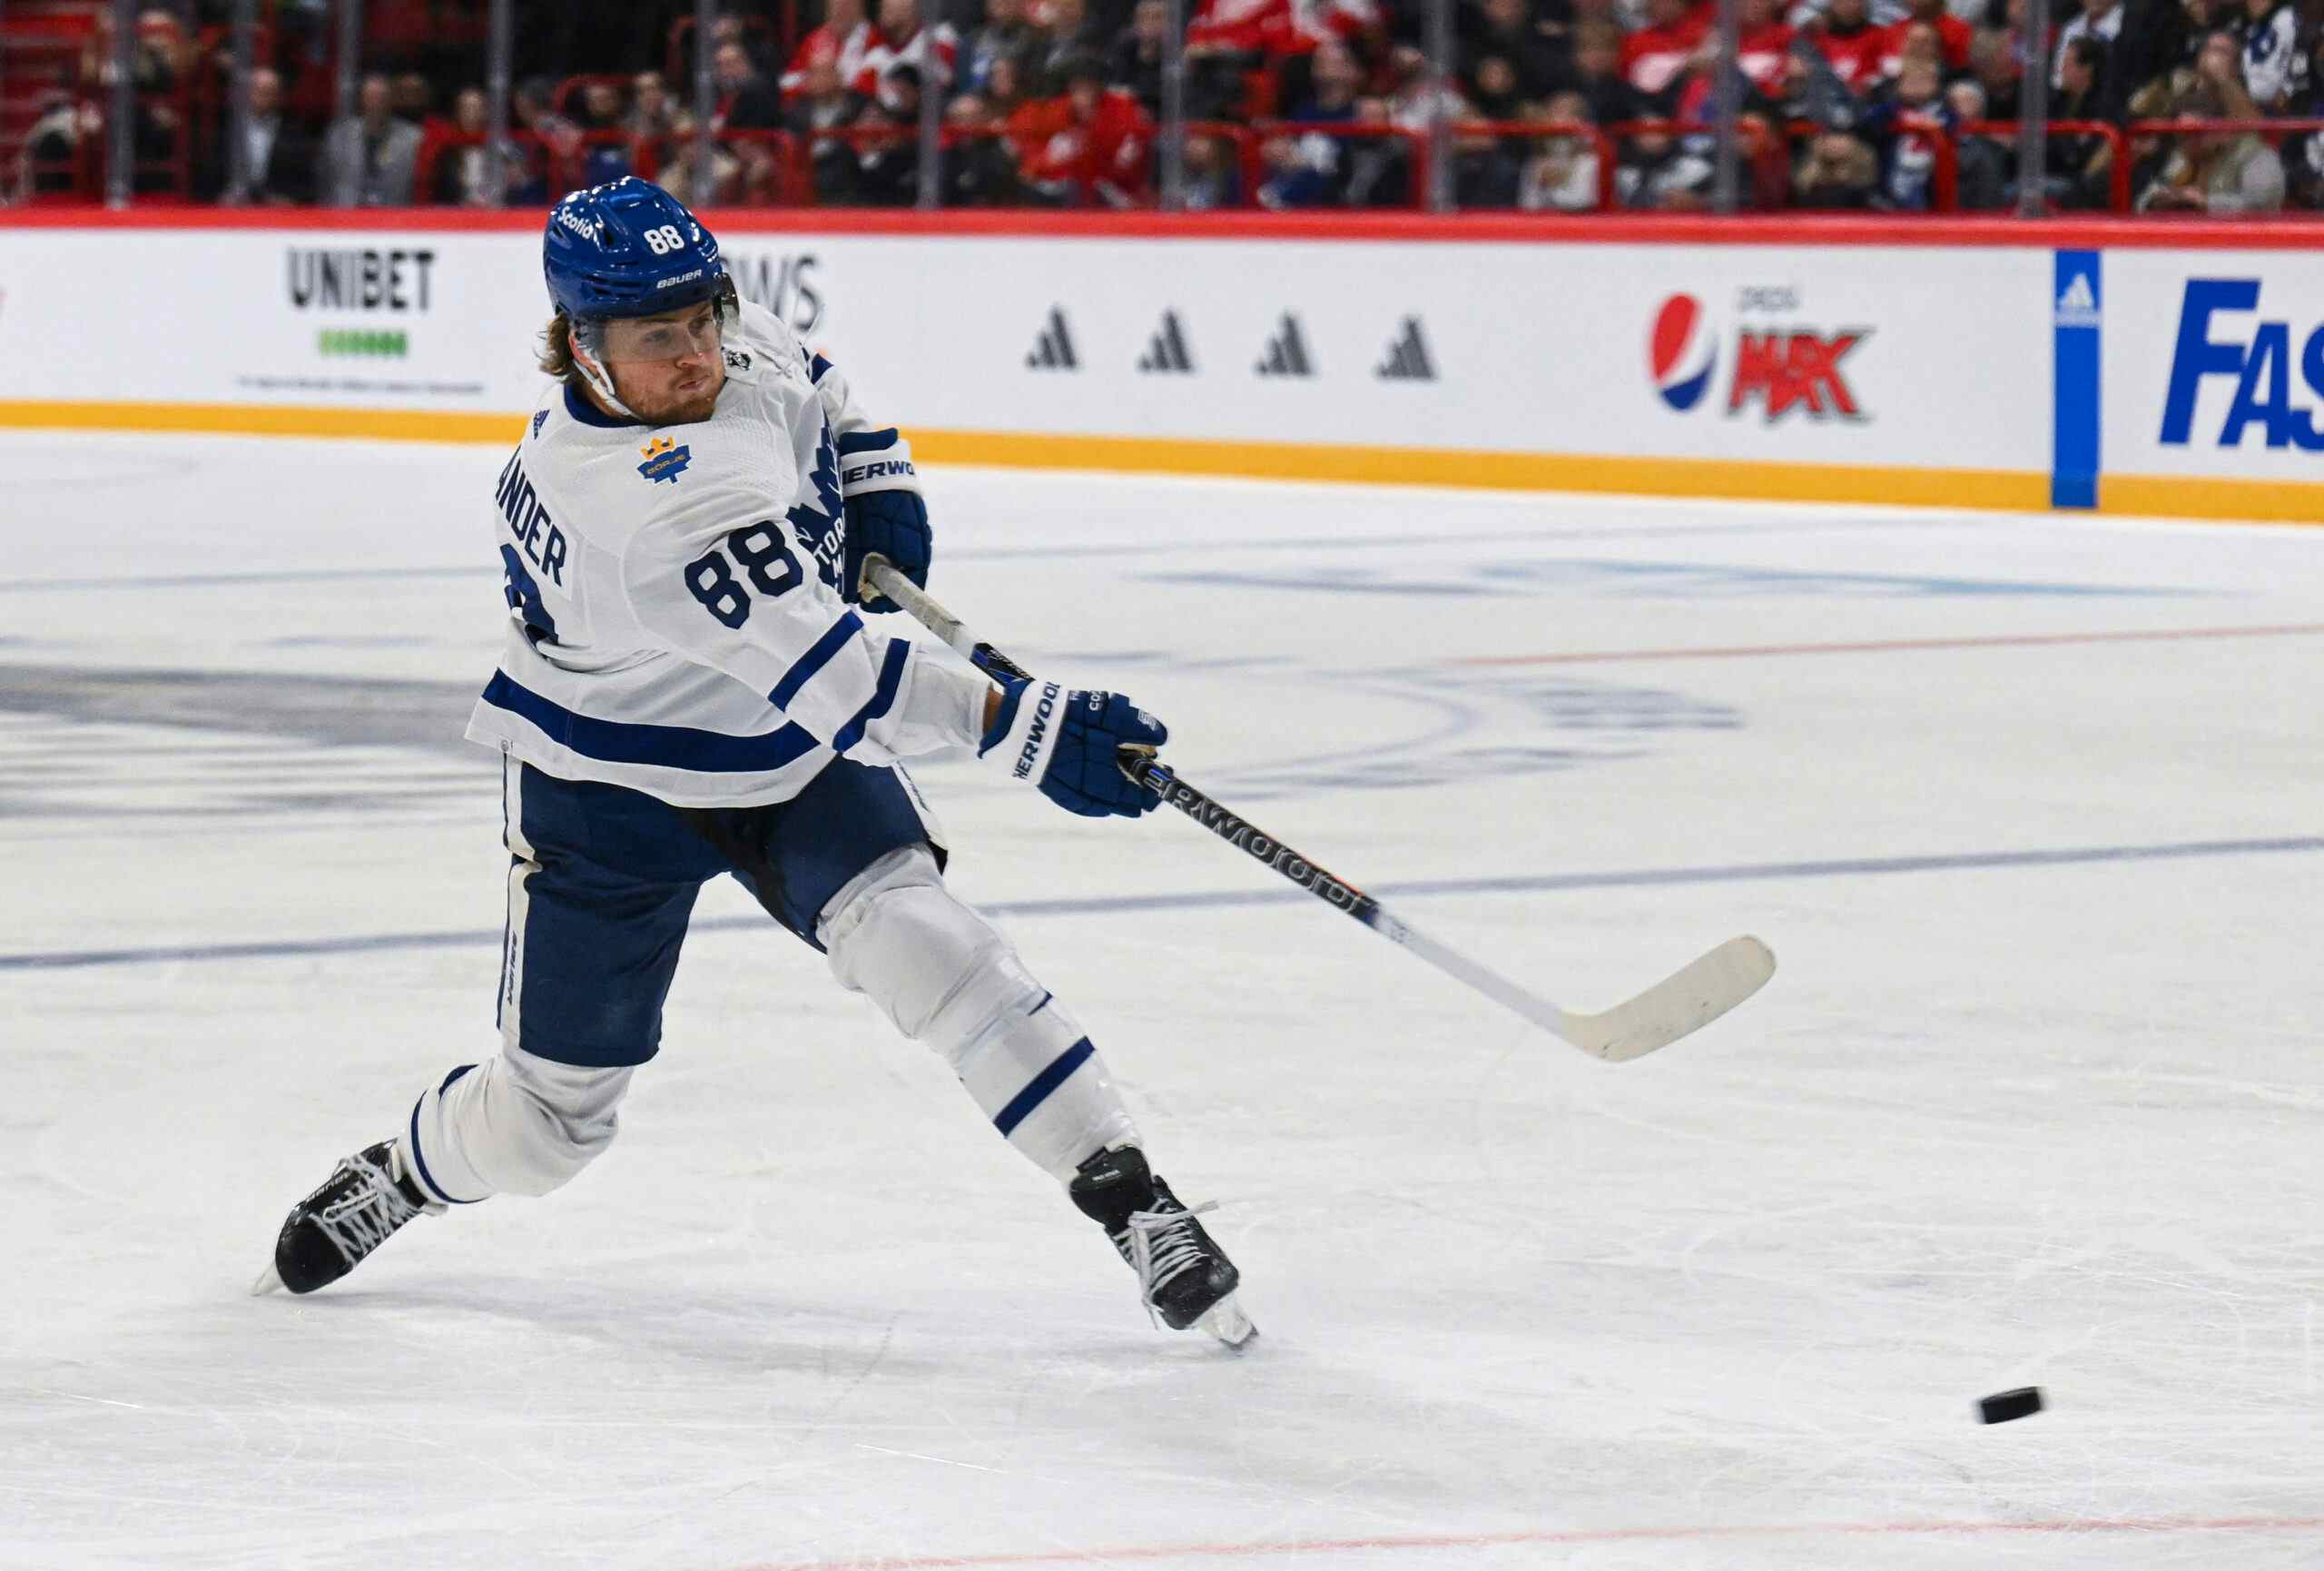
After two seasons of fans arguing whether or not Zach Hyman warrants a spot glued to Auston Matthews’ hip at 5v5, it looks as if we’re finally going to get to see Matthews with a different winger to his left.
It would be easy to look at Patrick Marleau’s 27 goals last year (and 535 career regular season goals) and think, yeah, obviously he’s going to be a big improvement on Zach Hyman and his 29 career goals over 180 career games. You may be correct in that assumption too, but there is a lot more to the game than individual scoring, so Iet’s dive into some more contextual components of each player’s game in an attempt to figure out whether or not the Matthews-Nylander duo is likely to be better off with Marleau than they were with Hyman at evens.
The first thing to note is that the Hyman-Matthews-Nylander trio have been extremely effective together in their two seasons of deployment. In 523 minutes together at 5v5 in 2016-17 the trio dominated to the tune of a 54.95% adjusted shot attempt differential, 55.33% expected goal differential, but just a 48.12% actual goal differential due to a low on-ice shooting percentage of 5.84% which could likely be attributed mostly to luck considering the solid shot locations they created.

In 2017-18 the trio was back to their dominant selves, although their share of the shot attempt differential dropped a little bit from 54.95% in 16-17 to 52.22% in 17-18. The line’s expected goal share was noticeably higher than their shot share, though, at 53.55%, which was 3.34% better than the team performed when the trio wasn’t on the ice. When you look at the shot location charts, both for and against, you can see that they created a lot more high-danger shots than they gave up, due much more to their offensive prowess than their defensive stability which should come as no surprise. This time, though, the line received all the luck they didn’t in the season prior and then some in the form of a 12.43% on-ice shooting percentage, more than doubling the prior season’s conversion rate.


This trio clearly wasn’t broken up due to incompetence, but rather due to the addition of another elite centre (have you heard that John Tavares is a Toronto Maple Leaf?) giving the team different options. The contrasting styles of Hyman and Marleau is interesting in terms of trying to project how the swap will impact the line’s performance. Hyman is a hard forechecking, grinding type who does most of his work along the boards and in the corners. Marleau is known for his speed (still, despite his age) and goal scoring ability. Head Coach Mike Babcock has long praised Hyman’s ability to “get the puck back,” so it will be interesting to see how the line performs without a player of that type and instead running with three highly skilled scoring types.
When digging deeper and into the microstats from last year, though, it starts to paint a picture pretty quickly that both Hyman and Marleau were passengers on their respective lines last year (Marleau played primarily on Nazem Kadri’s wing with Mitch Marner on the other wing half the time and Leo Komarov the other half). First, let’s take a look at each player’s individual shot contribution rates.

Neither player contributed to a particularly high amount of shots relative to their teammates, but when you consider that Hyman’s linemates were first and second on the team, I think you’d ideally like to see Hyman contribute to the offence more than he did, especially in terms of shot assists. Marleau contributed a decent amount of individual shots, but he’s no pass-first guy himself. Also, Kadri must have wanted to kiss Babcock when he took Komarov off that line and replaced him with Marner.
To get a more detailed look at each player’s passing contributions, we go to the player passing profiles.

This makes sense. Hyman contributed virtually nothing in terms of shot assists from anywhere except for from behind the net, where he created shot assists at an elite rate. This matches what you would think, intuitively, when you think of Hyman. He does most of his work below the goal line in the offensive zone, battling for the puck and shovelling it out front to Matthews or chipping it over to Nylander on the perimeter who will then look to find Matthews himself. To Hyman’s credit, passes from behind the net to the slot are very dangerous, so at least he’s creating from a dangerous area when he does.

Marleau created slightly more shot assists in the 32 game sample, but not nearly enough to ignore the fact that most of them were low-to-high (back to the point) which is not a dangerous shot at all, especially relative to Hyman’s niche of creating shots from behind the net. Marleau probably isn’t going to be a huge boon in terms of setting up his new linemates.
Research has shown that entering the offensive zone with possession of the puck (carry-in, pass-in) translates into more than twice as many shots created as entering the zone without possession of the puck (dump-ins). That seems significant. So, let’s take a look at how each player showed last year in terms of controlled zone entry rate. The top three guys shouldn’t come as much of a surprise (although eyeball emoji at #4). Hyman comes out looking better here and it’s all due to carry-ins, as he had the lowest rate of entry passes per hour among Leaf forwards. Marleau wasn’t all that involved in the zone entry game, although neither was Hyman relative to his two linemates. Again, it’s looking like both of these players leaned on their linemates to do the heavy lifting in most areas of the ice, which is likely more surprising to find about Marleau than Hyman since Marleau has had an illustrious career and Hyman was already viewed as the “other guy” out there doing the dirty work with Matthews and Nylander. Also, note how little Auston Matthews either dumps the puck in or fails. He’s good. Marleau probably won’t have to chip in too much more in transition with both his linemates being zone entry gods.

Furthermore, research has shown that exiting the defensive zone with control leads to your team going on the attack 88% of the time while dumping the puck out leads to the other team coming right back on the attack 70-72% of the time. Transition play is extremely important, as it turns out. Who would’ve thought? Now, zone exits are more often carried out by defencemen, but good forwards still help out more often than others because, again, it’s very important to play in the other end. That’s how you get shots and getting shots is how you get goals. You are now a Hockey Expert™. The usual suspects appear at the top of the graph and the same passengers appear on the bottom half. Again, Hyman is slightly more involved here, but these are raw rate statistics so they can be misleading due to the fact that Hyman spent all of his time with Matthews and Nylander, numbers one and two in this area. 

It seems that in the neutral zone game in general (entries + exits) Hyman may have been slightly more involved than Marleau was last year, but both players leaned heavily on their linemates (or singular when Komarov was with Kadri and Marleau), although swapping one player for the other will probably result in a negligible difference in transition.
The tradeoff between the two, ultimately, seems to come down to the improvement in finishing ability with the addition of Marleau and the perceived downgrade on the forecheck and ability to retrieve the puck down low, which is hard to quantify. What we can attempt to quantify statistically, however, is the difference in scoring ability. Over the last two years Marleau has outscored Hyman at 5v5, scoring at a rate of .81 goals per hour to Hyman’s .51, a significant drop off. A lot of that comes from Marleau shooting the puck more, at a rate of 12.96 shot attempts per hour while Hyman fired an average of 11.08 pucks at the net per 60 minutes of ice time, but a lot it comes from conversion rate as well. Hyman’s 5v5 shooting percentage of 7.06% is a couple percentage points below Marleau’s 9.87%, but it becomes even more stark when you look at expected fenwick shooting percentage based on shot location.


Both players like to shoot from directly in front of the net, which is a good place to shoot from! Hyman shoots from slightly closer in on average, though, resulting in a 9.08% expected fenwick shooting percentage, but his actual fenwick shooting percentage was only 5.31%. Marleau, on the other hand, converted to the tune of a 7.46 fenwick shooting percentage, only .29% lower than his expected fenwick shooting percentage, as opposed to Hyman’s 3.77% drop off between his expected and actual conversion rate.
All of this to say that it will be interesting to see how this line operates with the swap of these two players. You’re giving up the strong forechecking and behind the goal line play from Hyman in exchange for the higher efficiency and volume shooter in Marleau. Nylander is an elite playmaker and Matthews is definitely underrated in this area, so this could end up being a pretty good bet for Babcock.
It’s going to be fun to see Babcock’s theory of Hyman’s puckhound style playing a huge factor in the former trio’s success put to the test in real time.
*shot location charts via hockeyviz.com
*zone transition data, shot contribution data via @ShutDownLine visuals via CJ Turtoro
*statistics via corsica.hockey.com
Recent articles from dylan fremlin

