Is Nylander Worth $8 Million?

5 years ago
As reported by some questionable sources, Nylander apparently wants a contract that will have him come in at a cap hit of $8 million per year. I say, give the man his damn money.
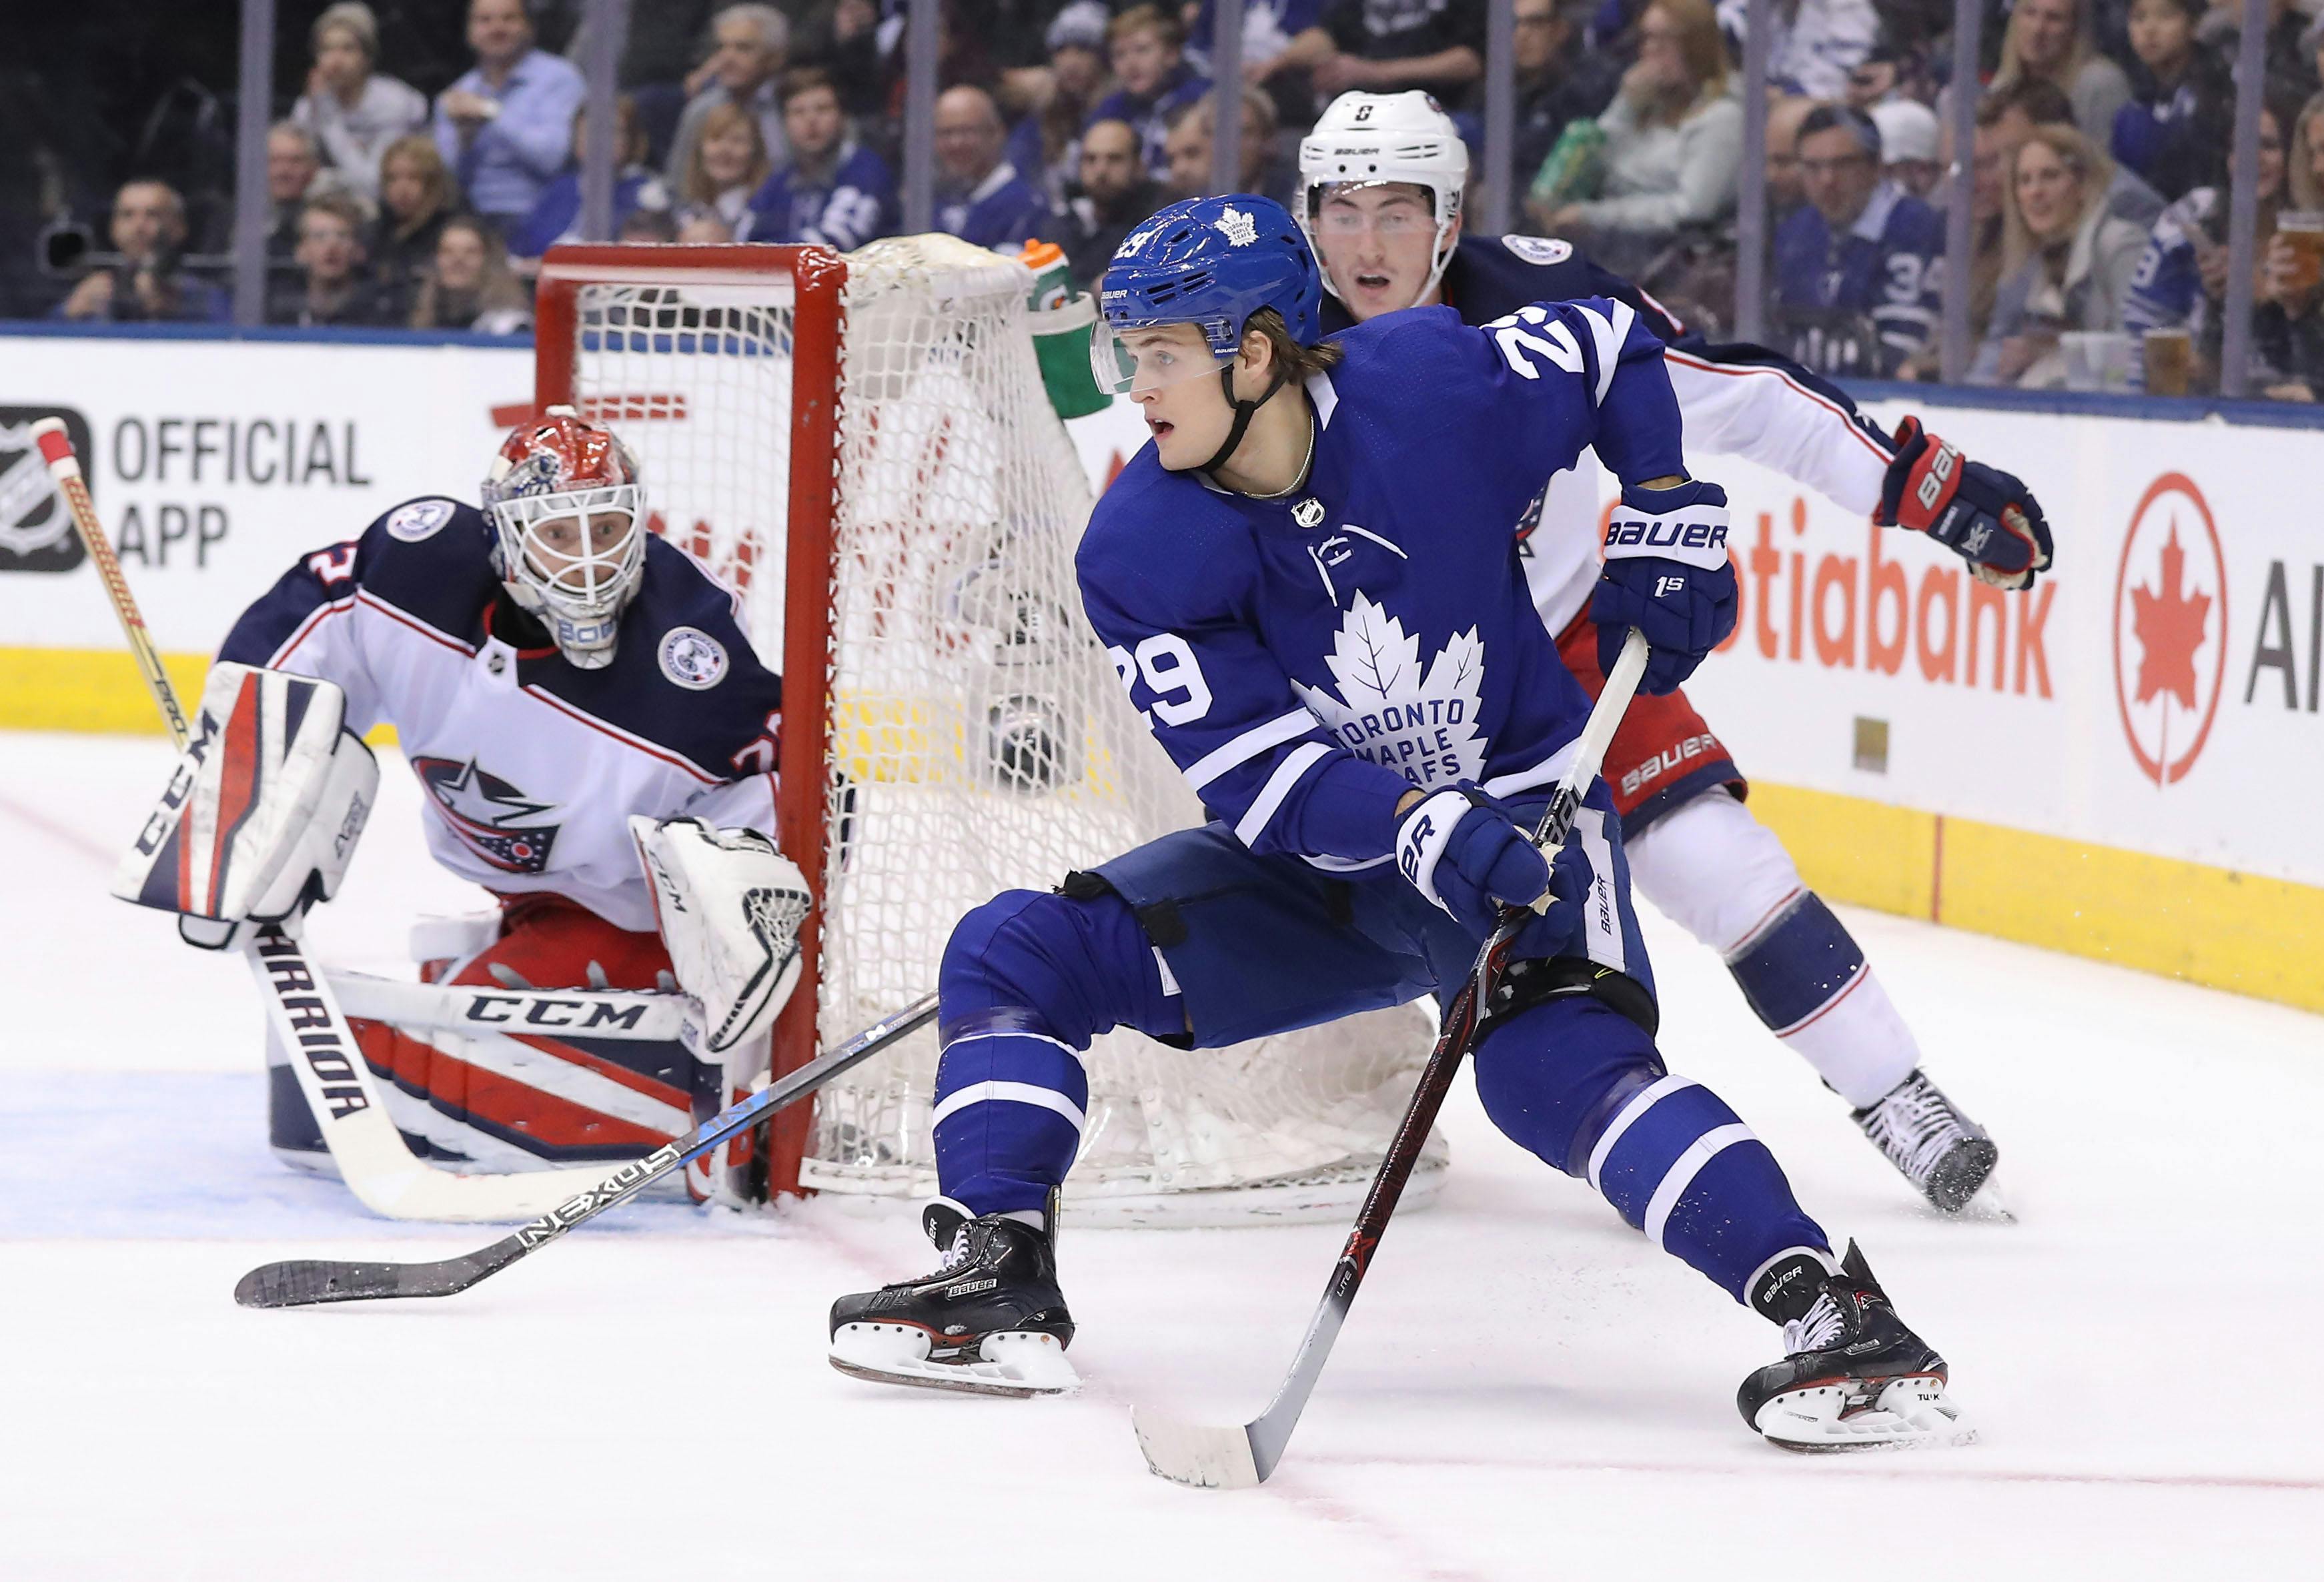
Although many fans do not want Nylander at that amount of money, he has simply proven his worth within his few years of being on this team. Consistently generating a ton of offense and being a very capable winger beside one of the best players ever to put on a Leafs jersey.
This is not about managing the team’s cap in context, this is about giving an extremely good player the money that he has earned in today’s market. With players like Tom Wilson, John Moore, and Jack Johnson, still getting outrageous contracts with all the knowledge of how to manage your team’s contracts under a hard cap system, it’s impossible to not justify $8 million for a high-skill player like Nylander.
Understandably, the ideal situation is to perfectly manage your team’s cap hit to be able to ice the best team for the least amount of cap. It’s not the reality of the NHL, but if you were able to simply break the system and offer contracts like it’s NHL 19 Be a GM mode, then sure you can manage that cap hit extremely well.
Some teams get lucky with the timing of players signing their deals and then turning into a player that is worth more than what they are making, but again, that is not realistic and there are so many factors that go into having a “good contract”. The current health of the player, signing early before they breakout, and the player simply wanting to take less because “it’s good for the team” – these are some reasons that we see so many undervalued players around the league today.
Why should Nylander be one of those players?
What is so wrong about a player earning the contract that he signs? Nylander has demonstrated at such a young age, to be one of the best players in this league.
He has the potential to be an elite playmaker by today’s NHL standards – he has even shown to be that in under 200 NHL games.


From this graph created by Ryan Stimson with data from EvolvingWild, Corey Sznajder, and Corsica, Nylander puts himself and his teammates in areas to create scoring chances. He is usually not the one that has the scoring chance himself, but his pass quality and shot creation are in the top-tier of the league.
His Primary Shot Contributions per 60 minutes (PSC60) is in the 96th-percentile of the league. That means there are only a handful of players that can get a shot off towards the net, or make a quality pass to a teammate that can do that, at a more efficient rate than Nylander can.
Even when he shoots the puck, it is in such a quality spot because of his own and his teammate’s individual plays. Nylander is in the 93rd-percentile of Individual Expected Goals per 60 minutes (ixG60) – that demonstrates his ability to get into the dangerous areas of the ice.
According to NaturalStatTrick, among players that played at least 1000 minutes last season (basically meaning top-6 players), Nylander had the 20th-most individual scoring chances in the entire league, with 171. Our own John Tavares was 19th when he was with the Islanders last season.
Even when Nylander is not strictly known as a shooter or a player that gets scoring opportunities, he is still in the upper echelon of individual offense weapons in this league.
Not only is he able to create scoring chances while in the offensive zone, but Nylander is excellent at controlling the puck while successfully entering that offensive zone. All plays start from somewhere and Nylander has often been the go-to forward to bring the puck intially into the other team’s zone.


This graph from CJ Turtoro with data provided by Corey Sznajder, excellently demonstrates his contribution to bringing the puck into the offensive zone. Nylander has an excellent success rate for entering the most important area of the ice with possession of the puck. No amount of dumping the puck in can replace the value in having a player that can enter the zone successfully like this.
As demonstrated by this piece by Charlie O’Connor, a forward that can enter the zone is extremely valuable. That skill is very repeatable and a stellar component for generating offense on the ice.
As Charlie puts it, “If only one entry metric is available, Controlled Entry Percentage appears to be the most valuable in evaluating forwards. It showed the highest level of repeatability, was correlated strongest with on-ice shot creation, and predicted both shot and goal generation better than wE/60.”
Nylander’s controlled entry percentage (PossEntry%) is in the 88th-percentile of the league. Broken down into the two separate years that Corey was able to compile this data, Nylander was in the 89th-percentile in the 2016-17 season, and in the 81st-percentile for the 2017-18 season. He is consistently a top player when it comes to entering the zone and generating the kind of offense that a team needs to win games.
I can already hear so many fans yelling, “Yeah but Matthews does everything for him and he’s only a secondary piece on that line!” – to that I say, isn’t it nice to have as many offensive weapons as you can?
Even without Matthews, Nylander has shown his ability to create scoring chances and be on the ice for important offensive plays.
Through the two years that the pairing has been able to be on the ice together, they have demonstrated one thing. They are more effective when they are together than when they apart.
| 2016-17 | TOI | 5v5 CF% | 5v5 GF% | 5v5 SCF% | 5V5 HDCF% | PDO | |
| Matthews w/ Nylander | 624:42 | 55.19 | 52.17 | 57.05 | 59.27 | 0.997 | |
| Matthews w/o Nylander | 536:13 | 46.80 | 51.02 | 47.53 | 47.14 | 1.011 | |
| Nylander w/o Matthews | 426:04 | 48.31 | 45.45 | 47.61 | 45.81 | 0.995 | |
| 2017-18 | |||||||
| Matthews w/ Nylander | 718:13 | 50.87 | 67.53 | 54.09 | 52.90 | 1.075 | |
| Matthews w/o Nylander | 210:42 | 47.12 | 64.71 | 51.64 | 58.23 | 1.049 | |
| Nylander w/o Matthews | 416:43 | 48.92 | 51.35 | 51.71 | 46.85 | 1.025 |
data via NaturalStatTrick.com
As it becomes increasingly clear, the combination of Matthews and Nylander on the ice together is absolutely lethal to their opposition. But when they have spent (albeit limited) time away from each other, they both suffer in most categories.
The only area that Nylander does not seem to affect Matthews a whole lot is when it comes to simply scoring goals. Matthews is some sort of anomaly when it comes to scoring, so his 5v5 GF% stays fairly level without Nylander. But everywhere else there is a significant drop in production when either is without each other.
Kapanen might look stellar on Matthew’s wing currently, but in such a small sample size it is not very predictable what that might look long-term. Nylander is the best option by far and he should be seen as a priority and in the top tier of Leafs players.
What looks like a challenge right now, might be a little easier to figure out when comparing contracts around the league to what Nylander should earn.
Most notably, the comparison has been made between Nylander, David Pastrnak, and Nikolaj Ehlers. All first-round picks in the 2014 NHL Draft, they have gone on to have stellar young careers in similar positions. All wingers and all elite offensive groups.
Just last September, David Pastrnak signed a 6-year $40 million dollar contract, coming in at $6.66M against the cap. At the time of signing, that contract had a Cap Hit Percentage (CH%) of 8.89.
Under the current salary cap of $79.5-million, a cap hit of the same percentage is $7.06M. Meaning that if Nylander did, in fact, sign the identical contract under today’s cap, that it will put him just above a $7-million cap hit.
With Ehlers, he signed a 7-year $42 million dollar extension last season as well – that comes in at an 8.00 CH%. Doing the exact same math, under today’s cap that comes in at a $6.36M hit.
Other than just their contracts, how do these three really compare as players on the ice?

Using EvolvingWild’s GAR model, here is a graph created by Sean Tierney that beautifully demonstrates each player’s true value and contribution to their team in each season they have played.
Considering that David Pastrnak was able to join a Boston Bruins team that already had elite players on it and Nikolaj Ehlers joined a Winnipeg Jets team that had an established core in place – these players are similar when you break it down to one numerical value.
Last season is the most interesting, Nylander finished slightly above both players after being towards the bottom just the year prior. Which coincides when the Leafs were at their best they have been with Nylander on the roster.
Pastrnak’s contract is only a year old and is already considered a bargain, so why should we expect Nylander to sign the same type of deal?
As I have said before, a current contract with the same CH% of Pastrnak’s deal would come in at a $7.06M cap hit. Are we really that worried about spending $950k more than some people want to?
That is one Entry-Level Contract, or a 13th forward/7th defenceman worth of cap. If we want to nitpick about the amount of cap Nylander takes up, then don’t compare it to the Pastrnak deal. Simply not having a Josh Leivo or Tyler Ennis on your 23-man roster is the difference between having Nylander at $8.0M or having Nylander sign for the current day cap hit of Pastrnak’s contract.
Sure, every single dollar of your salary cap is important – but when it comes to elite talent like Nylander, there is no way that less than a million dollars is worth that much.
Hell, the Leafs have more than that difference going towards Phil Kessel’s current contract right now.
The only thing that can go wrong with Nylander signing for a $8M cap hit, is if Dubas signs a bad contract. Almost every team in the league has that one contract that doesn’t look so good. We should be confident that Dubas will find ways to squeeze players that are undervalued in under the cap.
Players like Ennis, Leivo, Brown, and Hyman, are the players that you try to squeeze under the cap – secondary, complementary, and peripheral players. You do not try to pinch every penny when signing elite players like Nylander.
That idea comes into play with one glaring contract comparable that should be included. Leon Draisaitl’s current deal is what he is worth.
His contract only looks like a problem because the Oilers currently have $11.95M of their cap space locked up in Milan Lucic, Zack Kassian, and Kris Russel. Absolutely awful bottom-tier players that should not be earning anything close to that. Those are the types of players that I believe Dubas will just have to steer clear from and accept that defencemen like Justin Holl making less than $1M will contribute just as much as Kris Russell making $4M.
In 31 Thoughts this week, Elliotte Friedman went over what next season’s cap could be.
“At the Board of Governors meeting last week, the NHL provided 2019–20 cap estimates ranging from $81.4 million (no NHLPA inflator) to $85.4 million (the full five per cent). (The players committed to 1.25 for 2018–19.)”
To keep it consistent, if the players committed a 1.25% inflator again for next season, that sees the salary cap rising to $82.4 million. If Nylander was to sign a contract with an $8M cap hit, that will then mean a 9.7CH% for that contract as soon as next season.
Just last season, a contract with the same CH% comes in at a $7.275M cap hit.
With the NHL’s revenue most likely rising and more teams being added to increase that, the cap might be skyrocketing in the upcoming seasons.
Players should be paid what they are worth and Nylander is currently worth 8 million dollars a season.
Recent articles from Thomas Williams