Joffrey Lupul sees “too much of Chara for his own good”

By Cam Charron
11 years ago
The Leafs Nation is lucky enough to be partnered with NHL Numbers, a website that analyzes hockey through objective numbers and tries to clear roadblocks and hurdles for the rest of us. The goal? Providing us with a better understanding of the hockey players and teams we love so much and pay so much to watch.
This can mean anything for us, how effective players were, to what kind of competition they were playing against, even to how many penalties they took and drew. The NHL doesn’t record everything on its website, but it does record several events and who was on the ice: goals, missed shots, hits, takeaways, you can pretty much decipher, if you use all the available information, exactly what happened when any given player was out on the ice.
And this brings us to quality of competition.
Quality of competition has gone through several iterations. The base one is best explained here in the Arctic Ice Hockey (formerly known as Behind the Net) FAQ section. It evolved by comparing players to the plus/minus of their opponents to their Corsi—or shot differential—rates.
But a problem was found here. Eric T of NHLNumbers was sorting through the data and found that Quality of Competition, or how we’d been using it, didn’t make much of a difference:
[If] we just ask “how does a guy do if he faces goons most of the year”, the answer will be “not so great”, because he’s probably a goon himself. We never get to run the experiment where Pavel Datsyuk plays against goons for the better part of a season. But he does get the occasional shift against them, and we can finally answer this question by looking at the data at the individual shift level instead of at the season level. We can reframe the question as “how much better does the average player do in the shifts where he faces goons than the shifts where he faces top lines” and thereby remove the influence of how often he actually faces each opponent and how good he is.
The graph Eric showed was that every player played better against weak opponents, and worse against strong opponents, but there wasn’t enough separation between “strong” and “weak” opponents to make any real difference over the course of the season except in extreme cases.
To correct for this, Eric proposed a new system over at NHL Numbers yesterday (I’ll get to the Leafs implications in a bit) but basically, it goes away from an average number. If I told you that Player A had a Rel QoC of 0.400 and Player B had a Rel QoC of 0.600, you’d know that Player B faced against tougher opponents. But how much of a difference would it make?
Solving the problem, Eric decided to look around shot rates and at a simpler number in an attempt to determine which players played against the toughest opponents:
A little over a year ago, a group of analysts was asked what stats they turn to first. Such leaders in the field as Gabe Desjardins, Jonathan Willis, and Tom Awad all said that if they only get one stat, they’re going to look at ice time.It makes sense — a player’s ice time is a direct reflection of the coach’s opinion of the player, and at this relatively early stage in the evolution of analytics, the coach’s opinion is more accurate than any one individual statistic.
What’s the average ice-time that a player faced? Eric also sorted between time spent against forwards and defence. What did he find? That the players who are drastically the most underrated by the traditional quality of competition metric that statisticians have been using are primarily scorers.
They see a lot more time against defencemen who play upwards of 20 minutes, and their relatively weak Rel QoC scores come from the fact that they see a lot of checking lines that traditionally play against a lot of scorers and top offensive players, players who are set up to have weak shot-differential counts for and against when they’re on the ice.
What does this mean for the Leafs?
Well, here are the Rel QoC scores (the average Relative Corsi of opponents faced) of the Leafs forwards from last season via Behindthenet.ca:
| Rel QoC | |
|---|---|
| Kulemin | 0.892 |
| MacArthur | 0.720 |
| Grabovski | 0.686 |
| Lupul | 0.512 |
| Connolly | 0.428 |
| Steckel | 0.379 |
| Bozak | 0.340 |
| Kessel | 0.337 |
| Frattin | 0.285 |
| Crabb | 0.135 |
| Lombardi | -0.108 |
| Brown | -0.175 |
The problem is that there is very little separation here. We can’t tell what kind of good players Kulemin is out against, whether they’re checkers or scorers. It makes a pretty big difference.
This chart better explains it: the horizontal x-axis is the average minutes played by opponents’ forwards, and the vertical y-axis is the average minutes played by opponents’ defence:

This tells you something different. There was very little separation in the quality of forwards most Leafs played against, but there was a huge difference in the level of defencemen. As Eric explained in an email, “some depth would help the first line out a lot; they saw too much Chara for their own good.”
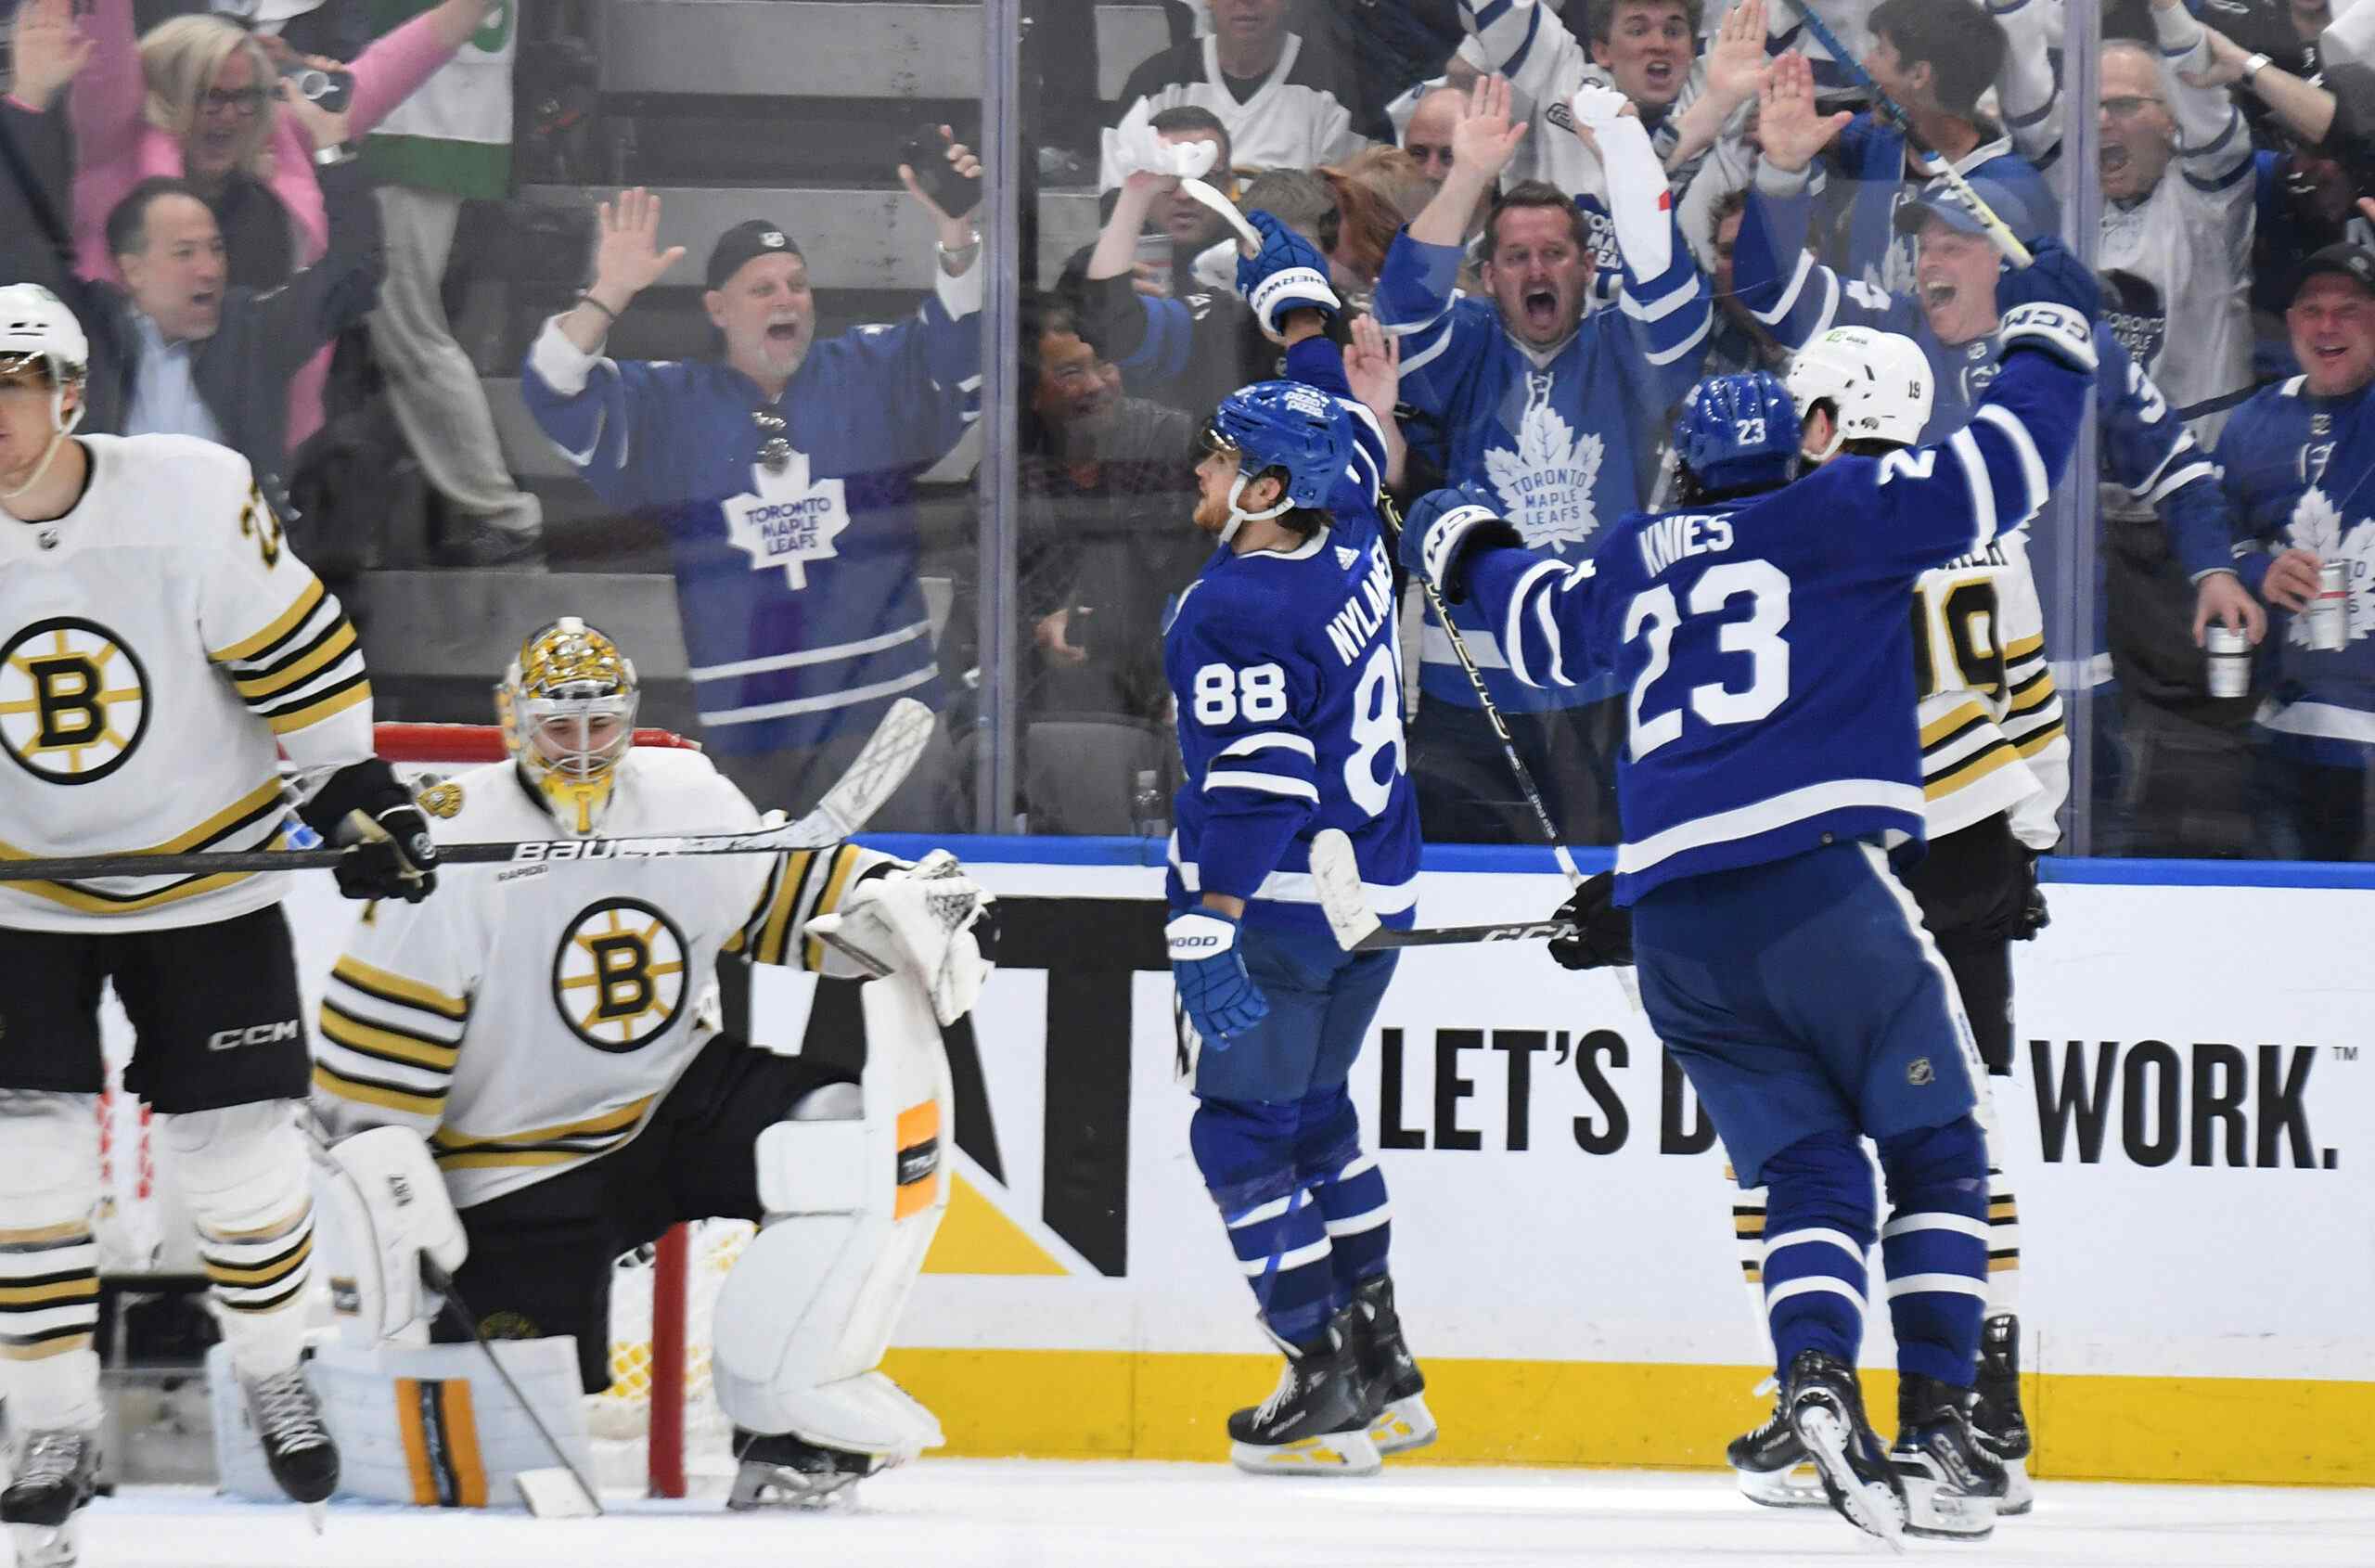
In fact, defencemen primarily faced by Joffrey Lupul averaged 20.6 minutes a game, which was the highest in the entire National Hockey League. 2, 3 and 4 were respectively Claude Giroux, Rick Nash and Daniel Sedin. It wasn’t just Lupul, however. Phil Kessel and Tyler Bozak saw the big-minute defencemen more than anybody else on the team by a wide margin.
You can see another big plot in the middle and the depth players are generally pretty low on the chart.
Here’s how it works out, league rank in parentheses:
| Opp F TOI | Opp D TOI | |
|---|---|---|
| Lupul | 15.57 (147) | 20.60 (1) |
| Kessel | 15.48 (175) | 20.39 (9) |
| Bozak | 15.40 (193) | 20.23 (30) |
| Grabovski | 15.49 (169) | 19.53 (147) |
| Connolly | 15.39 (196) | 19.50 (153) |
| MacArthur | 15.47 (178) | 19.49 (157) |
| Kulemin | 15.56 (151) | 19.39 (168) |
| Lombardi | 14.80 (287) | 18.98 (267) |
| Steckel | 15.18 (237) | 18.92 (285) |
| Brown | 14.60 (310) | 18.91 (291) |
| Frattin | 15.06 (258) | 18.88 (300) |
| Crabb | 15.12 (249) | 18.84 (304) |
Final caveat. When the first study came out from Eric, I theorized what difference this made for Dion Phaneuf, who saw disproportionaly more time against the top forwards that any other defenceman on the Leafs. Eric also sent me numbers for defencemen:
| Opp F TOI | Opp D TOI | |
|---|---|---|
| Phaneuf | 16.09 (16) | 19.68 (30) |
| Gunnarsson | 15.89 (36) | 19.61 (57) |
| Liles | 14.97 (142) | 19.58 (66) |
| Komisarek | 15.53 (111) | 19.53 (86) |
| Franson | 14.80 (159) | 19.43 (120) |
| Schenn | 14.68 (168) | 19.41 (131) |
| Gardiner | 14.78 (163) | 19.35 (143) |
You can see that the forwards Phaneuf plays against are much better than the ones Gardiner sees. This is ranked by Opp D TOI faced, and you can see very little separation between top and bottom. As explained by Eric:
It looks pretty clear that nobody says “I want to get my top pair against their top pair”, so they all end up facing the opposing D equally and the 30th (out of 198) is not too different from the 143rd in opposing defense TOI. So their competition is nearly 100% driven by which forwards they face.
That explains why there is probably such little separation in forwards faced and defenceman faced.
So, small hurdles cleared. Phaneuf plays against some of the best forwards in the league, because their coaches trust them with the most ice time. Lupul, Kessel and Bozak play against disproportionately tough defencemen, and you know that because their coaches send them out more than they do any other player.
Recent articles from Cam Charron