logo

Playoff Preview: Edmonton Oilers
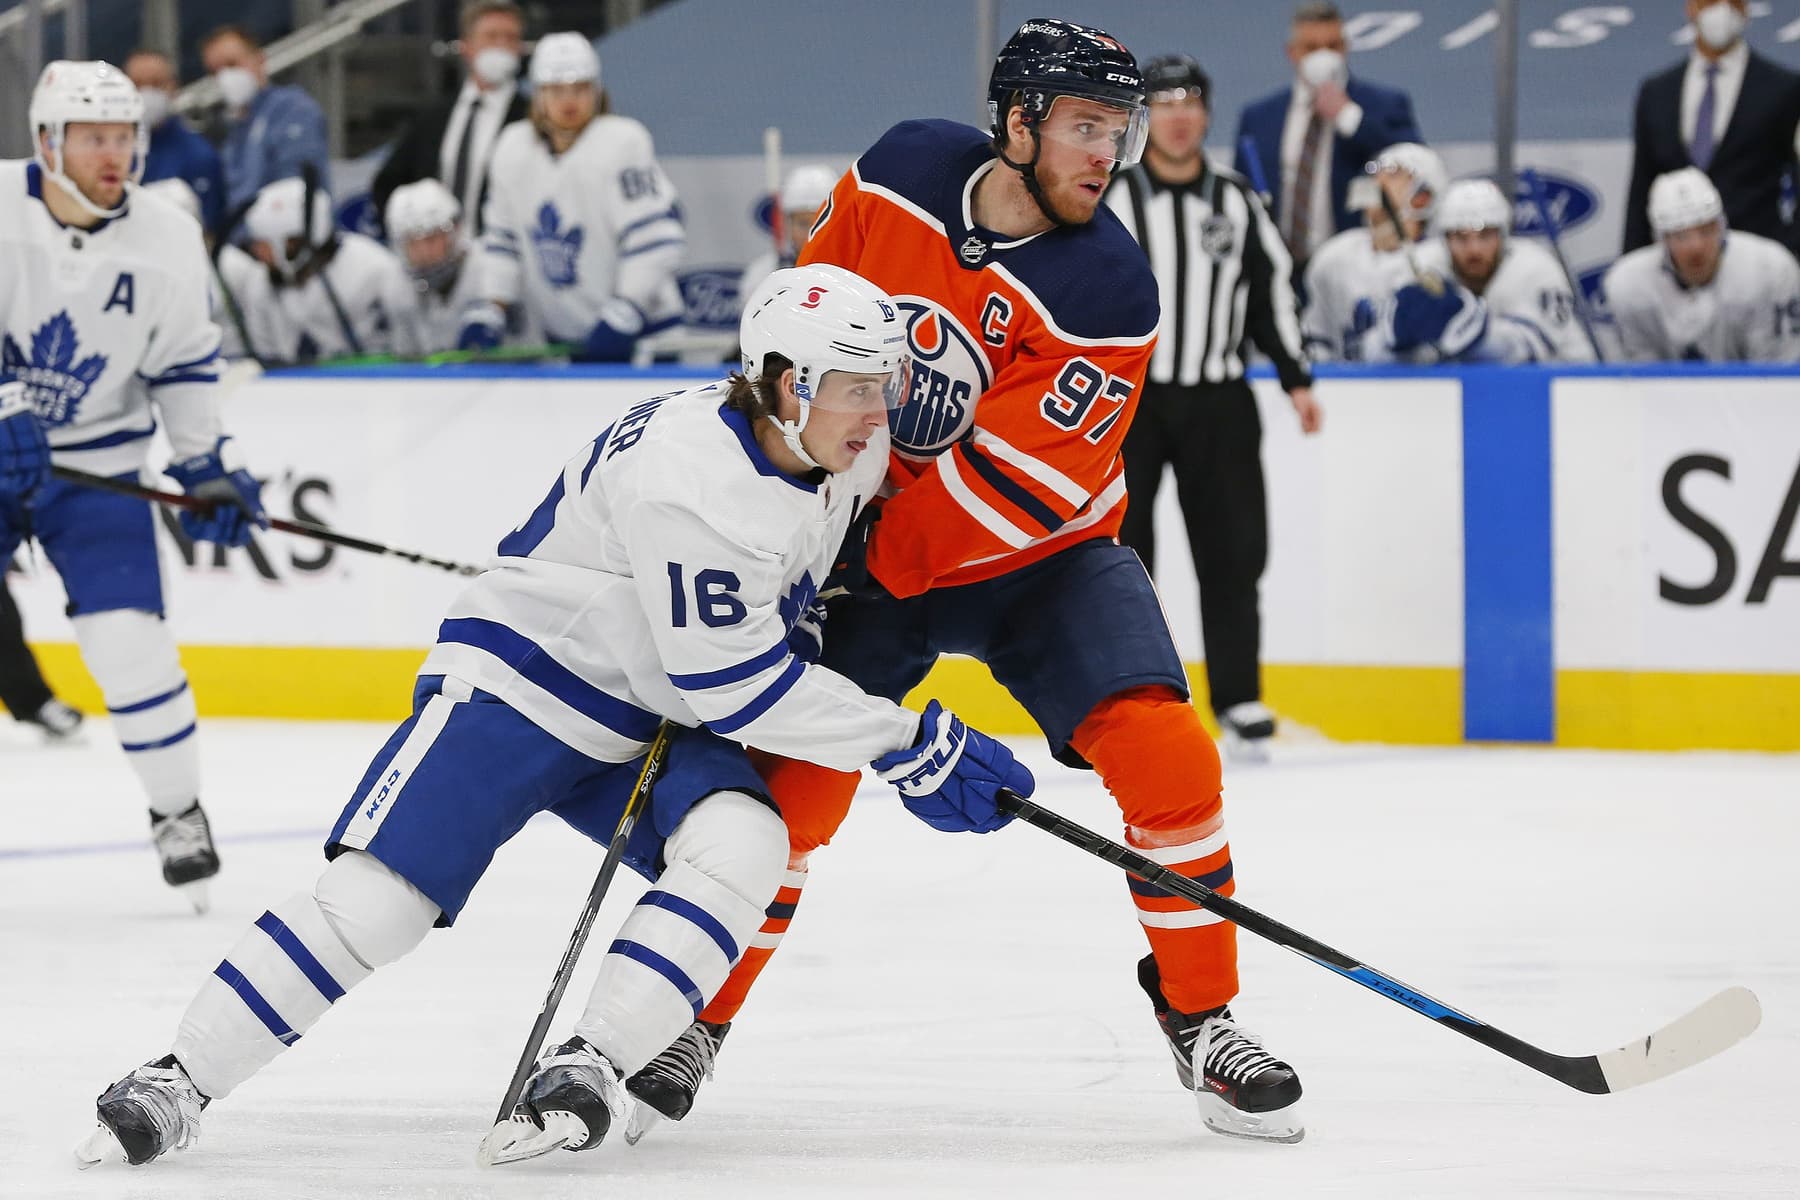
alt
Photo credit:Perry Nelson-USA TODAY Sports
Ryan Hobart
2 years ago
Author’s note: This article was written on May 11th, and uses data for this season up to that date only. Each team has played two additional games, which does not influence the data enough to change the conclusions drawn below.
While the Leafs aren’t expected to face the Edmonton Oilers in the first round of this year’s playoffs, as usual, what is unusual about this season is that the Leafs may potentially face Edmonton in the second round of the playoffs.
The format being the four teams atop each division playing off against each other, and the Leafs and Oilers both being in a Canada-only division, things are a bit unusual this year to say the least.
This year’s Edmonton Oilers have been a moderate success under GM Ken Holland (who was drafted in the 1975 NHL draft by the Maple Leafs, funnily enough, though he never played for Toronto) in his second season at the head of the club. They will finish second in the division with a healthy cushion both above them relative to Toronto and below them relative to Montreal and Winnipeg.

Traditional Stats

In the typical box-score-type stats that everyone is familiar with, the table below shows how the Oilers compare to the Leafs.
TeamGPWLOTLPP%RWROWS/O WinGFGAPP%PK%Net PP%Net PK%Shots/GPSA/GPFOW%
Toronto Maple Leafs5435136760.7042934118114020.377.716.279.931.127.951
Edmonton Oilers5434182700.6483134017814727.482.126.283.43030.550.5
From nhl.com
With the Leafs and Oilers being tied in Regulation and Overtime Wins (ROW), the apparent gap between the two suddenly diminishes. The Oilers also have the stronger special teams, both in terms of normal PP and PK percentages, and in terms of “net” PP and PK percentages, where you offset failed PKs with shorthanded goals for, and the reverse for powerplays.
However, the Leafs have allowed fewer goals and shots against, and generated more goals for and shots for. Not by a large margin in either case, mind you, but still, they have the advantage.

Advanced Stats

We can also look at some more advanced statistics to compare the teams. If you’re not sure about these numbers, check out my primer on advanced stats.
NameTeamGPGF%SF%FF%CF%xGF%GF/60GA/60SF/60SA/60FF/60FA/60CF/60CA/60Sh%Sv%
Maple LeafsTOR5458.6653.3152.852.2955.882.862.0230.2626.541.8437.3954.6849.899.4792.38
OilersEDM5450.3849.2349.3449.4949.872.552.5128.7629.6639.3440.453.0454.138.8891.52
From evolving-hockey.com, all stats 5-on-5 & score and venue adjusted.
Starting from the left and working towards the right, we see Goals For %. This is a calculated as a ratio of goals for to total goals. so if you score 5 goals and allow 5 goals, that’s a total of 10 goals, so you have a GF% of 5/10 = 50%. This is kind of a different way to express +/-, which is to say that it doesn’t mean all that much. It’s also pretty much repeating what we saw above by just looking at the goals numbers and special teams successes. Edmonton has the advantage in PP goals for and PK goals against, but these aren’t shown here because they’re 5-on-5 stats only.
Next, we get three different ways of counting pucks thrown at the net, all expressed as a ratio the same way that we saw goals previously. First is shots, so these are pucks that hit the goalie or go in the net, next is Fenwick, which is pucks that don’t get blocked on the way to the net, but may not be on net necessarily, and last is Corsi, which all pucks that get thrown at the net, whether they’re blocked, miss the net, hit the goalie, or hit the netting for a goal. The Leafs have a significant advantage in all of them, so we don’t have to do any weird justification on which one actually matters, we can just say the Leafs are a better team at throwing pucks at the net no matter how you count them.
Next is Expected Goals %, which is like Corsi but instead of just counting the shot attempts, you give each shot attempt a value based on how far away from the net it is. So the closer to the net your shot is, the more you expect it to be a goal, thus the higher your xGF% is. Again, this is a ratio like GF%. And again, the Leafs are significantly better than the Oilers.
If ratios aren’t your thing, I’ve also included the rates for each item For and Against in the latter columns.
The last columns are the team shooting and save percentages. These are tricky, because if they’re consistently good, you’re performing well, but if they’re very good for a short period of time, you’re probably getting lucky. Over 54 games, it’s more likely to be representative of ability than luck. This is good news for Toronto as they have better percentages for both shooting and saving.

Cup Odds

Both teams have guaranteed their spots in the playoffs, which is why we’re writing about them, but we can can use Money Puck to see what their odds are of progressing through the playoffs.
TeamMake PlayoffsMake 2nd RoundMake 3rd RoundMake FinalWin Cup
TOR100%74.7%51.8%30.5%17.8%
EDM100%69.3%28.9%11.7%5.1%
With a staggering 12.7% better chance to win the Stanley Cup, it’s obvious that the model that Money Puck uses to analyze these odds heavily favours Toronto when compared to Edmonton. But it’s not just Edmonton, Toronto has the highest chance to win the Cup according to Money Puck. Relative to the rest of the League, Edmonton has the 9th best odds to win the Cup.
Of course, it’s been said many times that the North division is the weakest of the four, and the model doesn’t factor relative division strength in its calculations. (I plan to look into that for this week’s Staturday column).

Final Thoughts

All in all, I don’t expect Toronto to have a tremendous amount of trouble dealing with the Oilers. What isn’t covered above is that they’re basically a one-dimensional threat. If you can find a way to shut down Connor McDavid, you’re in the clear. That’s certainly not an easy task, but it’s a singular focus rather than a multi-line threat like the Lightning or the Golden Knights.
If the Leafs do end up facing the Oilers, which I think is the most likely outcome, it will be a fun contest between two of the top players in the league in Matthews and McDavid. For now, the Leafs have to focus on Montreal, and the Oilers on the Jets.

Check out these posts...