logo

Staturday Weekly Column #13: Just how good is Jack Campbell?

alt
Photo credit:© Nick Turchiaro-USA TODAY Sports
Ryan Hobart
3 years ago
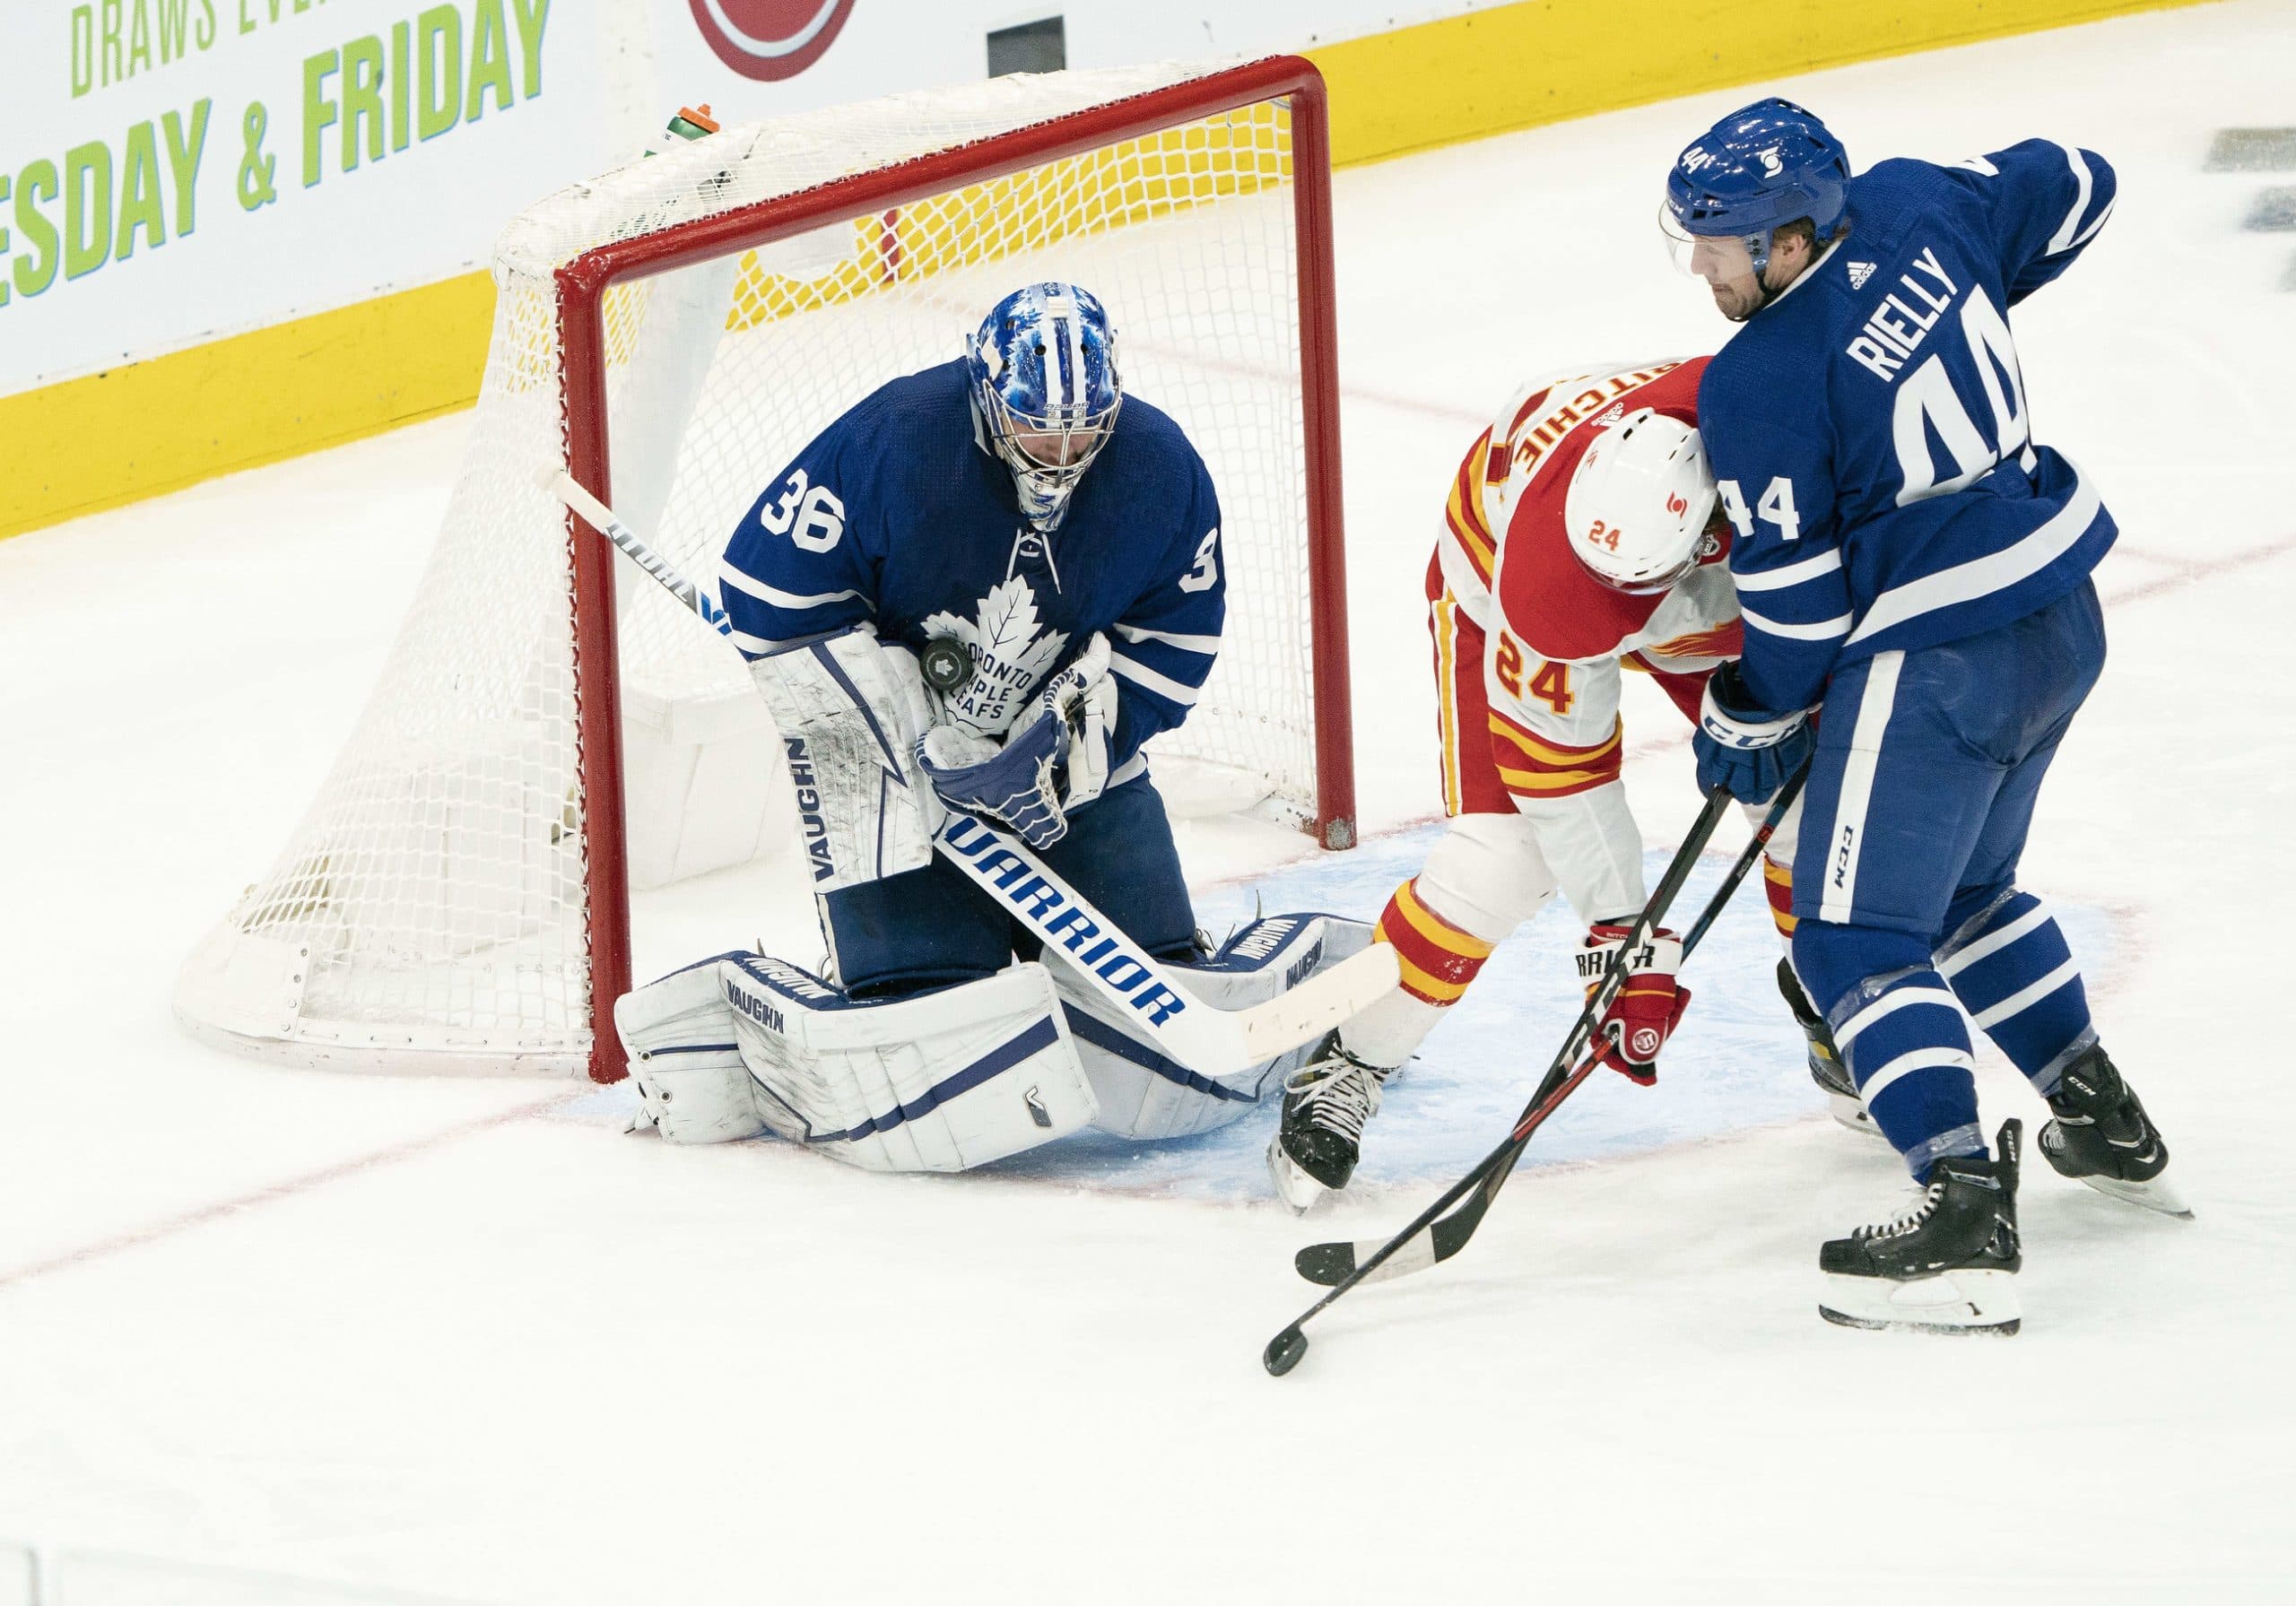
If a meme could say it all, I would leave at just a meme. But it’s true: Jack Campbell is SO hot right now. He has won all 8 of his starts so far this season and is making a pretty air-tight case that he’s the best choice for starting goaltender that the Maple Leafs have this season.
(Just realizing now that that’s Gwen Stefani and Gavin Rossdale in the background lol)
But, since this is Staturday, we’re going to delve into Jack Campbell a bit, both to see just how good he’s been, and to familiarize ourselves with some fancy goalie stats that you may not have come across before.
Campbell began his NHL career with the Dallas Stars, but made himself known as a member of the LA Kings. When Jonathan Quick was suffering from injury issues and general poor play in the 2018-19 season, it was a duo of Jack Campbell and Cal Peterson who stepped up to fill the void. They each posted higher than 92% save percentages that year, and 8 years after he was drafted, Campbell finally looked like he was ready to play regular minutes in the NHL.
Before that, he was a blue chip prospect goalie coming out of the OHL, including a season with Kyle Dubas’ Soo Greyhounds in 2011-12.
When the Dallas Stars drafted Campbell at 11th overall in 2010, they surely thought they were getting a potential franchise goalie. A mere 176 picks later, the Anaheim Ducks drafted a project goalie in Frederik Andersen, who ended up being, at least at one time, the best goalie from this draft class.
As we well know, eventually Campbell was brought in by Dubas to back-up Frederik Andersen and help the Maple Leafs in their Cup bid for the 2019-20 season, so famously interrupted by COVID-19.

Quality Starts

There are a few angles we can look at for evaluating goalies in a slightly fancier way than just save percentage, including Quality Starts (QS). Developed by Rob Vollman, a quality start is any game where a goalie has a save percentage greater than league average, or a save percentages greater than 88.5 when facing less than 20 shots on goal.
This isn’t hard hitting analysis, but it’s a quick and easy way to look at a goalie’s performance by factoring in that they can still have good games if they allow 2 goals in a really low-shooting game.
This season, Jack Campbell has 7 of 8 games listed as quality starts, with the 4-3 overtime win against Edmonton on March 27th not being a Quality Start as he had just an 85% save percentage on 20 shots. This is good for a Quality Start Percentage (QS%) of 87.5%, 4th in the league behind only a trio of goalies with just 1 start this year so far that have a perfect QS%.
There’s also a qualifier for “Really Bad Starts” that counts games where goalies have a save percentage below 85%. Since Campbell had exactly 85% in the Edmonton game, it doesn’t count as a really bad start, but it was certainly close.
From Hockey reference:
CareerNHL72643127616220261864.9202.434399736.5637
Goalie Stats
SeasonAgeTmLgGPGSWLT/OGASASVSV%GAASOMINQSQS%RBS
2017-1826LAKNHL5420211145134.9242.4802672.5000
2018-1927LAKNHL31251014161845784.9282.302159316.6403
2019-2028LAK/TORNHL26261112373761688.9042.800156711.4234
2020-2129TORNHL8880011223212.9511.3524907.8750

Goals Saved Above Average/Expected

The first more math-based statistic I want to look at is actually two different models that explain very similar concepts. The first is Goals Saved Above Average (GSAA), which looks at the league average save percentage and applies it to the number of shots a goalie has faced. The difference between what the goalie in question saved and what a league average goalie would save is GSAA.
As an example, if a particular goalie has a 92% save percentage on 1000 shots, he has 920 saves. If a statistically league average goalie would have a 91.5% and 915 saves on those same 1000 shots, theoretically. So, 920 – 915 is 5, so the goalie’s GSAA equals 5.
Jack Campbell has been great in this category so far at 8th in the league with a 9.24 GSAA on just 223 shots. The more shots a goalie faces, if their performance is consistently good, the higher GSAA will grow. So for Andrei Vasilevski, he has a 93.1% save percentage compared to Campbell’s 95.1%, but Vasilevski has almost double the GSAA at 18.18 because he’s faced more than triple the shots (810) Campbell has (223).
We can add another layer to this by replacing “Average” with “Expected” to get Goals Saved Above Expected (GSAE). This model, developed by DTMAboutHeart and was called xSv%, (which confusingly does not mean expected save percentage) uses shot data to figure out the expected number of goals allowed would be on the actual shots that goalie faced. The expected goals metric is based on distance from the net, angle, type of shot (slapshot, wristshot, one-timer, etc.), and the types of passes that lead up to the shot. Then, the different between the saves the particular goalie made and the “Expected saves” (shots against minus expected goals) is their Goals Saved Above Expected (GSAE).
From Money Puck:
Campbell sits 5th in the league in overall GSAE and first in the league, by a wide margin, in GSAE per 60 minutes of ice time (GSAE/60). Note, this is for goalies who have played at least 8 games, the default on Money Puck is a minimum of 10 games, so Campbell is a little bit below the normal cutoff. Still, this has been an impressive season so far.
Of all of the stats in this post, this is the one that can claim the best predictive value. That means that doing well at GSAE now means that they should have good Save Percentage in the future. As demonstrated by DTMAboutHeart, GSAE and xSv% (they’re the same idea with different names) can have an R^2 correlation of over 0.2 after a full season of games. As compared with GSAA, GSAE can be a significantly more valuable stat over a long period of time. However, in the short term, like these 8 games for Campbell, they’re equally valuable.

Goals Above Replacement

We’ve talked before about Goals Above Replacement (GAR) from Evolving Hockey as a statistical model. Essentially, it tabulates how much impact a player has had positively and negatively in different specific areas and as a whole. This model exists for goalies too, but this is the first I’ve posted about it. Here are Jack Campbell’s career numbers in GAR per 60 minutes of ice time (GAR/60) in years where he’s played more than 1 game). As with GSAA and GSAE, total GAR will grow with time as he gets more ice time, so expressing this as a rate means we can just focus on what his performance has been in the limited time he’s been able to play.
PlayerSeasonTeamPositionGPTOI_EVTOI_SHFA_EVFA_SHEVD_GAR/100FASHD_GAR/100FAGAR/60WAR/60
Jack Campbell17-18L.AG5266.622.515130-1.612.64-0.33-0.064
Jack Campbell18-19L.AG311592.8136.79971781.652.80.8060.15
Jack Campbell19-20L.A/TORG261567118.38831150.39-2.550.0160.003
Jack Campbell20-21TORG8404.536.4249433.644.471.340.228
The other main column besides GAR/60 is WAR/60, which is just GAR/60 but converting goals into wins. The columns at the front are context factors, such as Fenwick Against (FA) and Time On Ice (TOI), where “Fenwick” is a tally of shots that didn’t get blocked, so it includes both shots on goal and misses. This is for even strength and shorthanded play. Then, in the middle of the table, are the main components of the GAR model for goalies, Even Strength Defense (EVD) and Shorthanded Defense (SHD). The “/100FA” part of the columns means that the column is a rate per 100 unblocked shot attempts.
We can see that Campbell’s only positive season before coming to Toronto was that breakout 2018-19 season. He followed it up with a generally replacement-level season in 2019-20 split between LA and Toronto. Then we get to this season, where he’s posting an incredible GAR/60 at 1.34, which is currently leading the league for goalies who have played any amount of time in the NHL. Notably, he’s 12th in the league in overall GAR, which is pretty impressive.

Final Thoughts

No one should be surprised that the conclusion here is that Jack Campbell is having an incredible season so far. One of the main things that advanced stats in hockey try to focus on is predictive metrics. In that sense, GSAA and GSAE is our best bet, and in both of those numbers Campbell is exceeding. However, we’re talking about just 8 games of hockey. I wouldn’t make any long term bets on 8 games of hockey, no matter how good those 8 games were.
There will have to be more data to make any grand claims that Campbell is a top-5 goalie in the NHL. But with how good he’s been in this 2020-21 season, it seems that the worst case is that he’s a bona fide starter. Combining that with his apparent pet-dog-like personality, it is probable that the Leafs will give him an opportunity to succeed in a bigger role here for this season and the next, after which his contract expires.
Certainly, all of this will require another look at that point. But for now, let’s enjoy this run of great play from a Toronto goalie and pray that it continues even though it really never does.

Check out these posts...