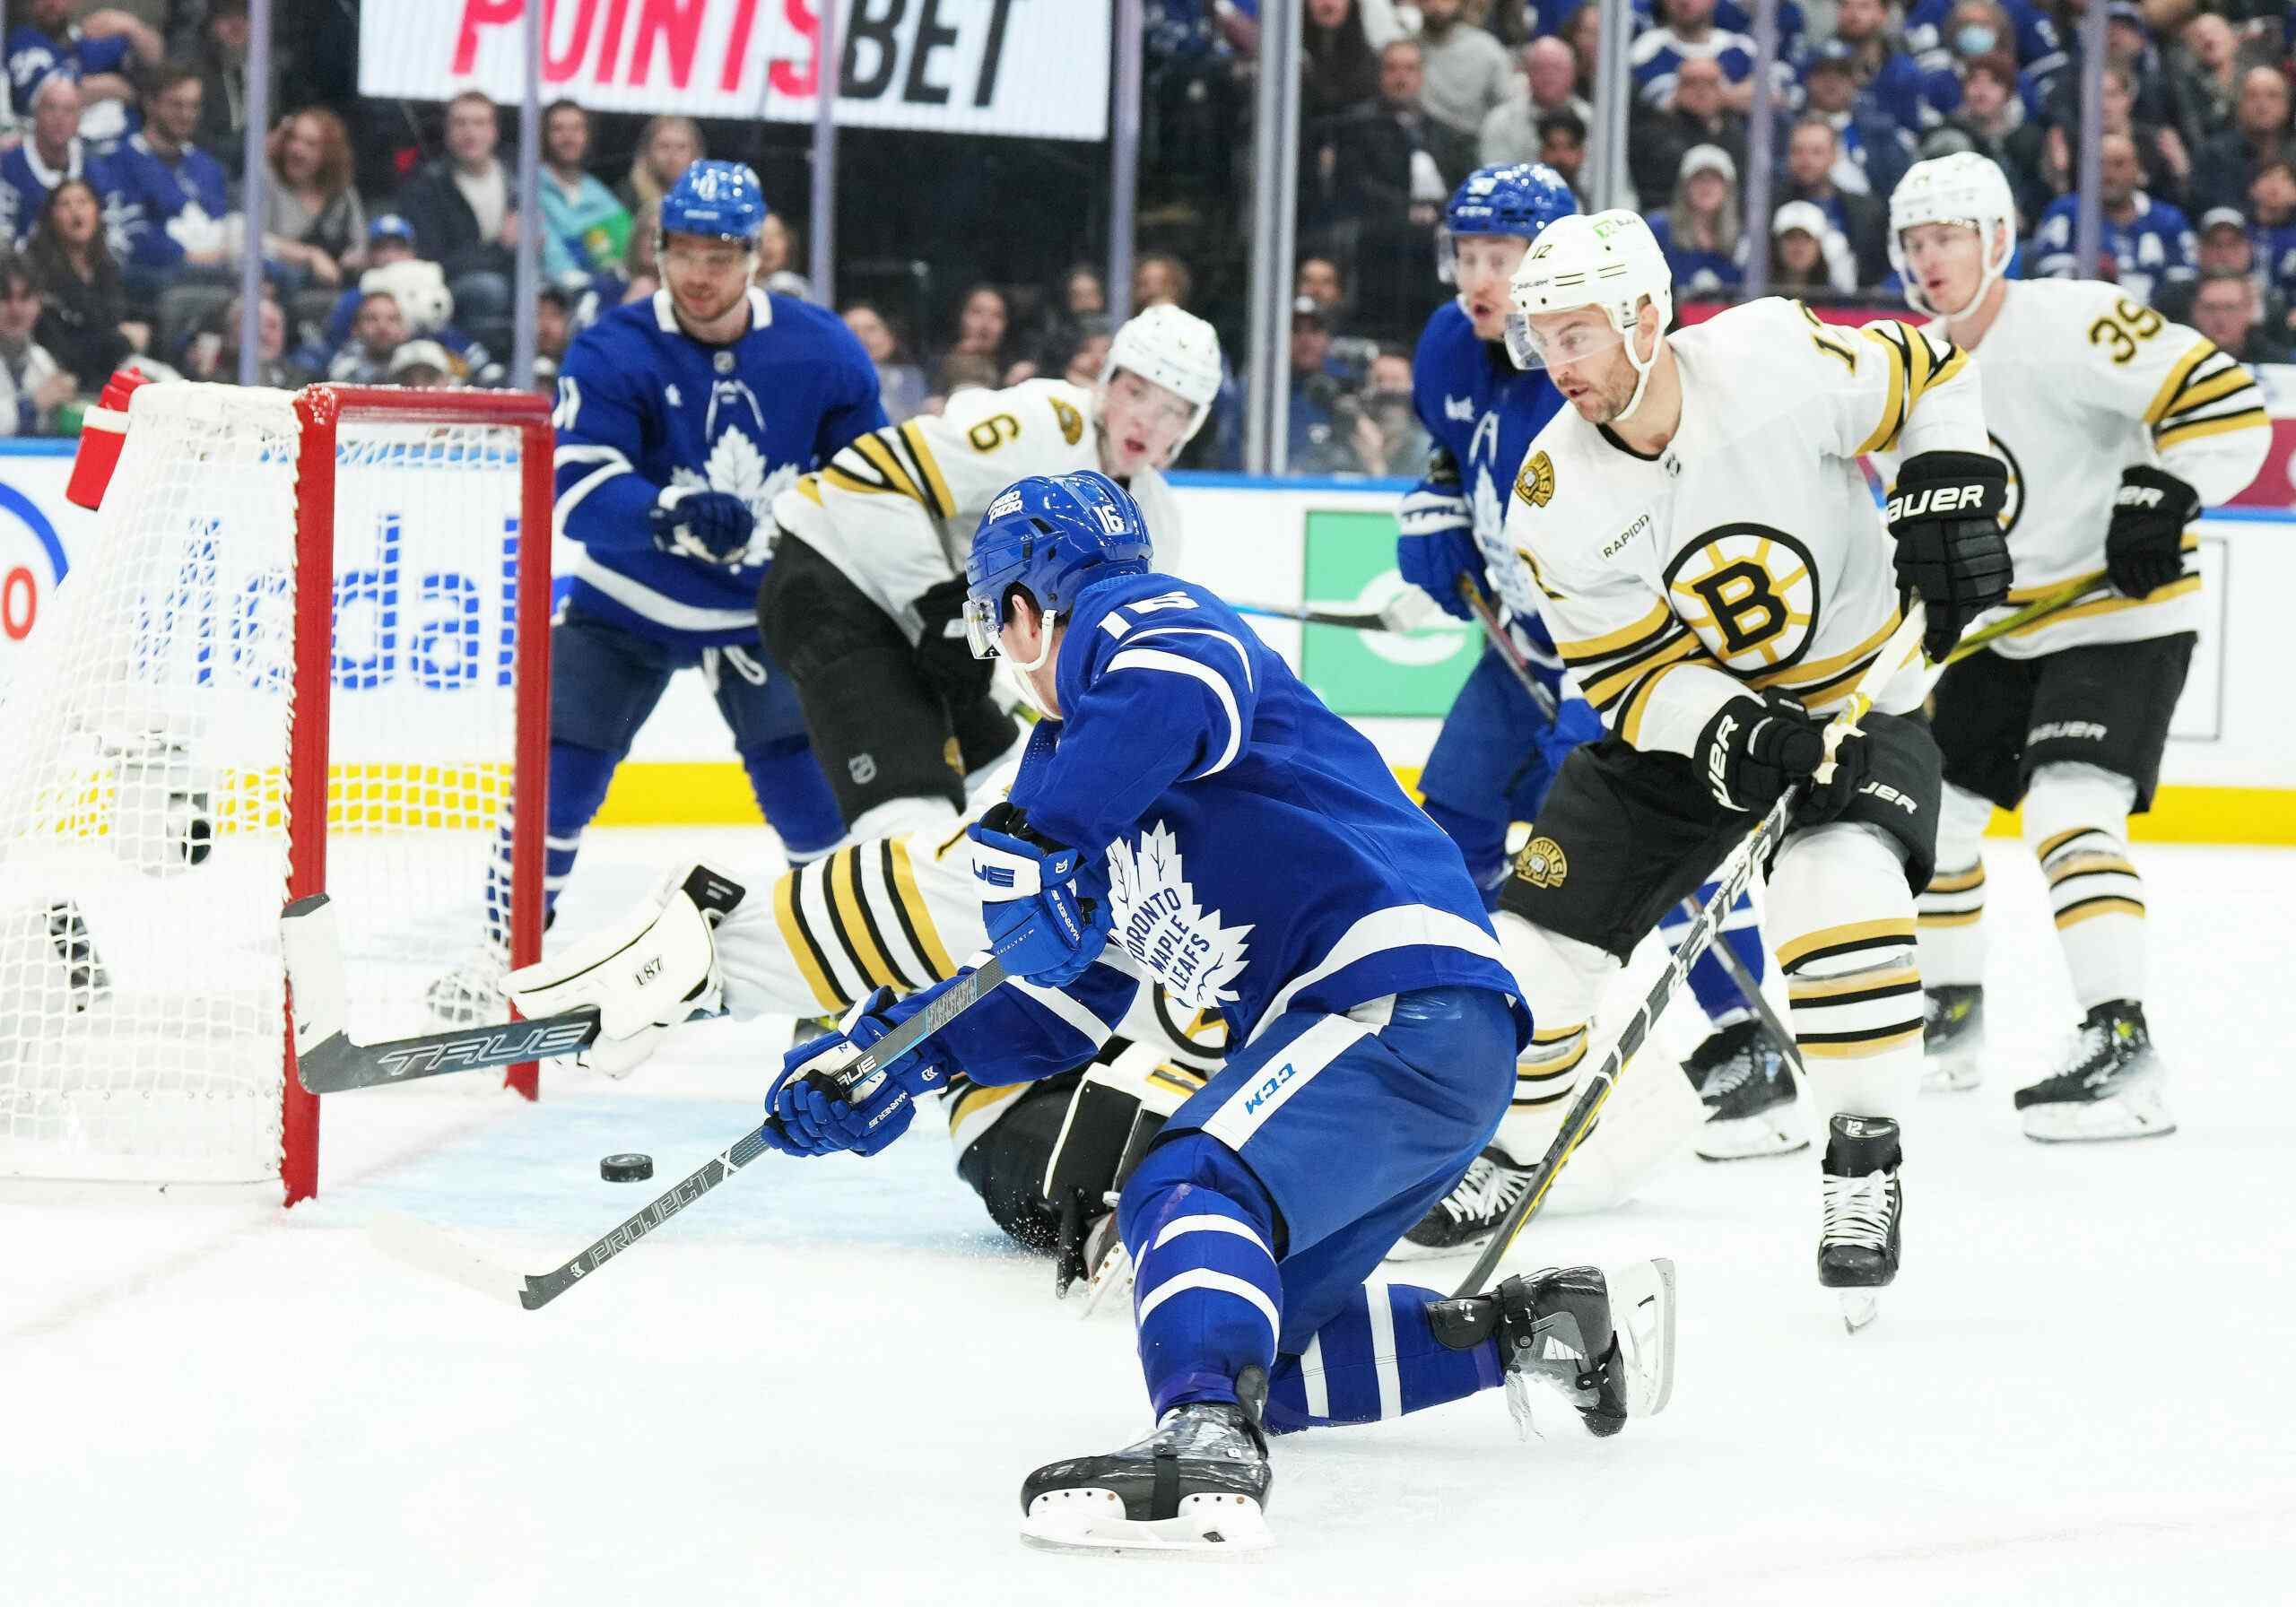
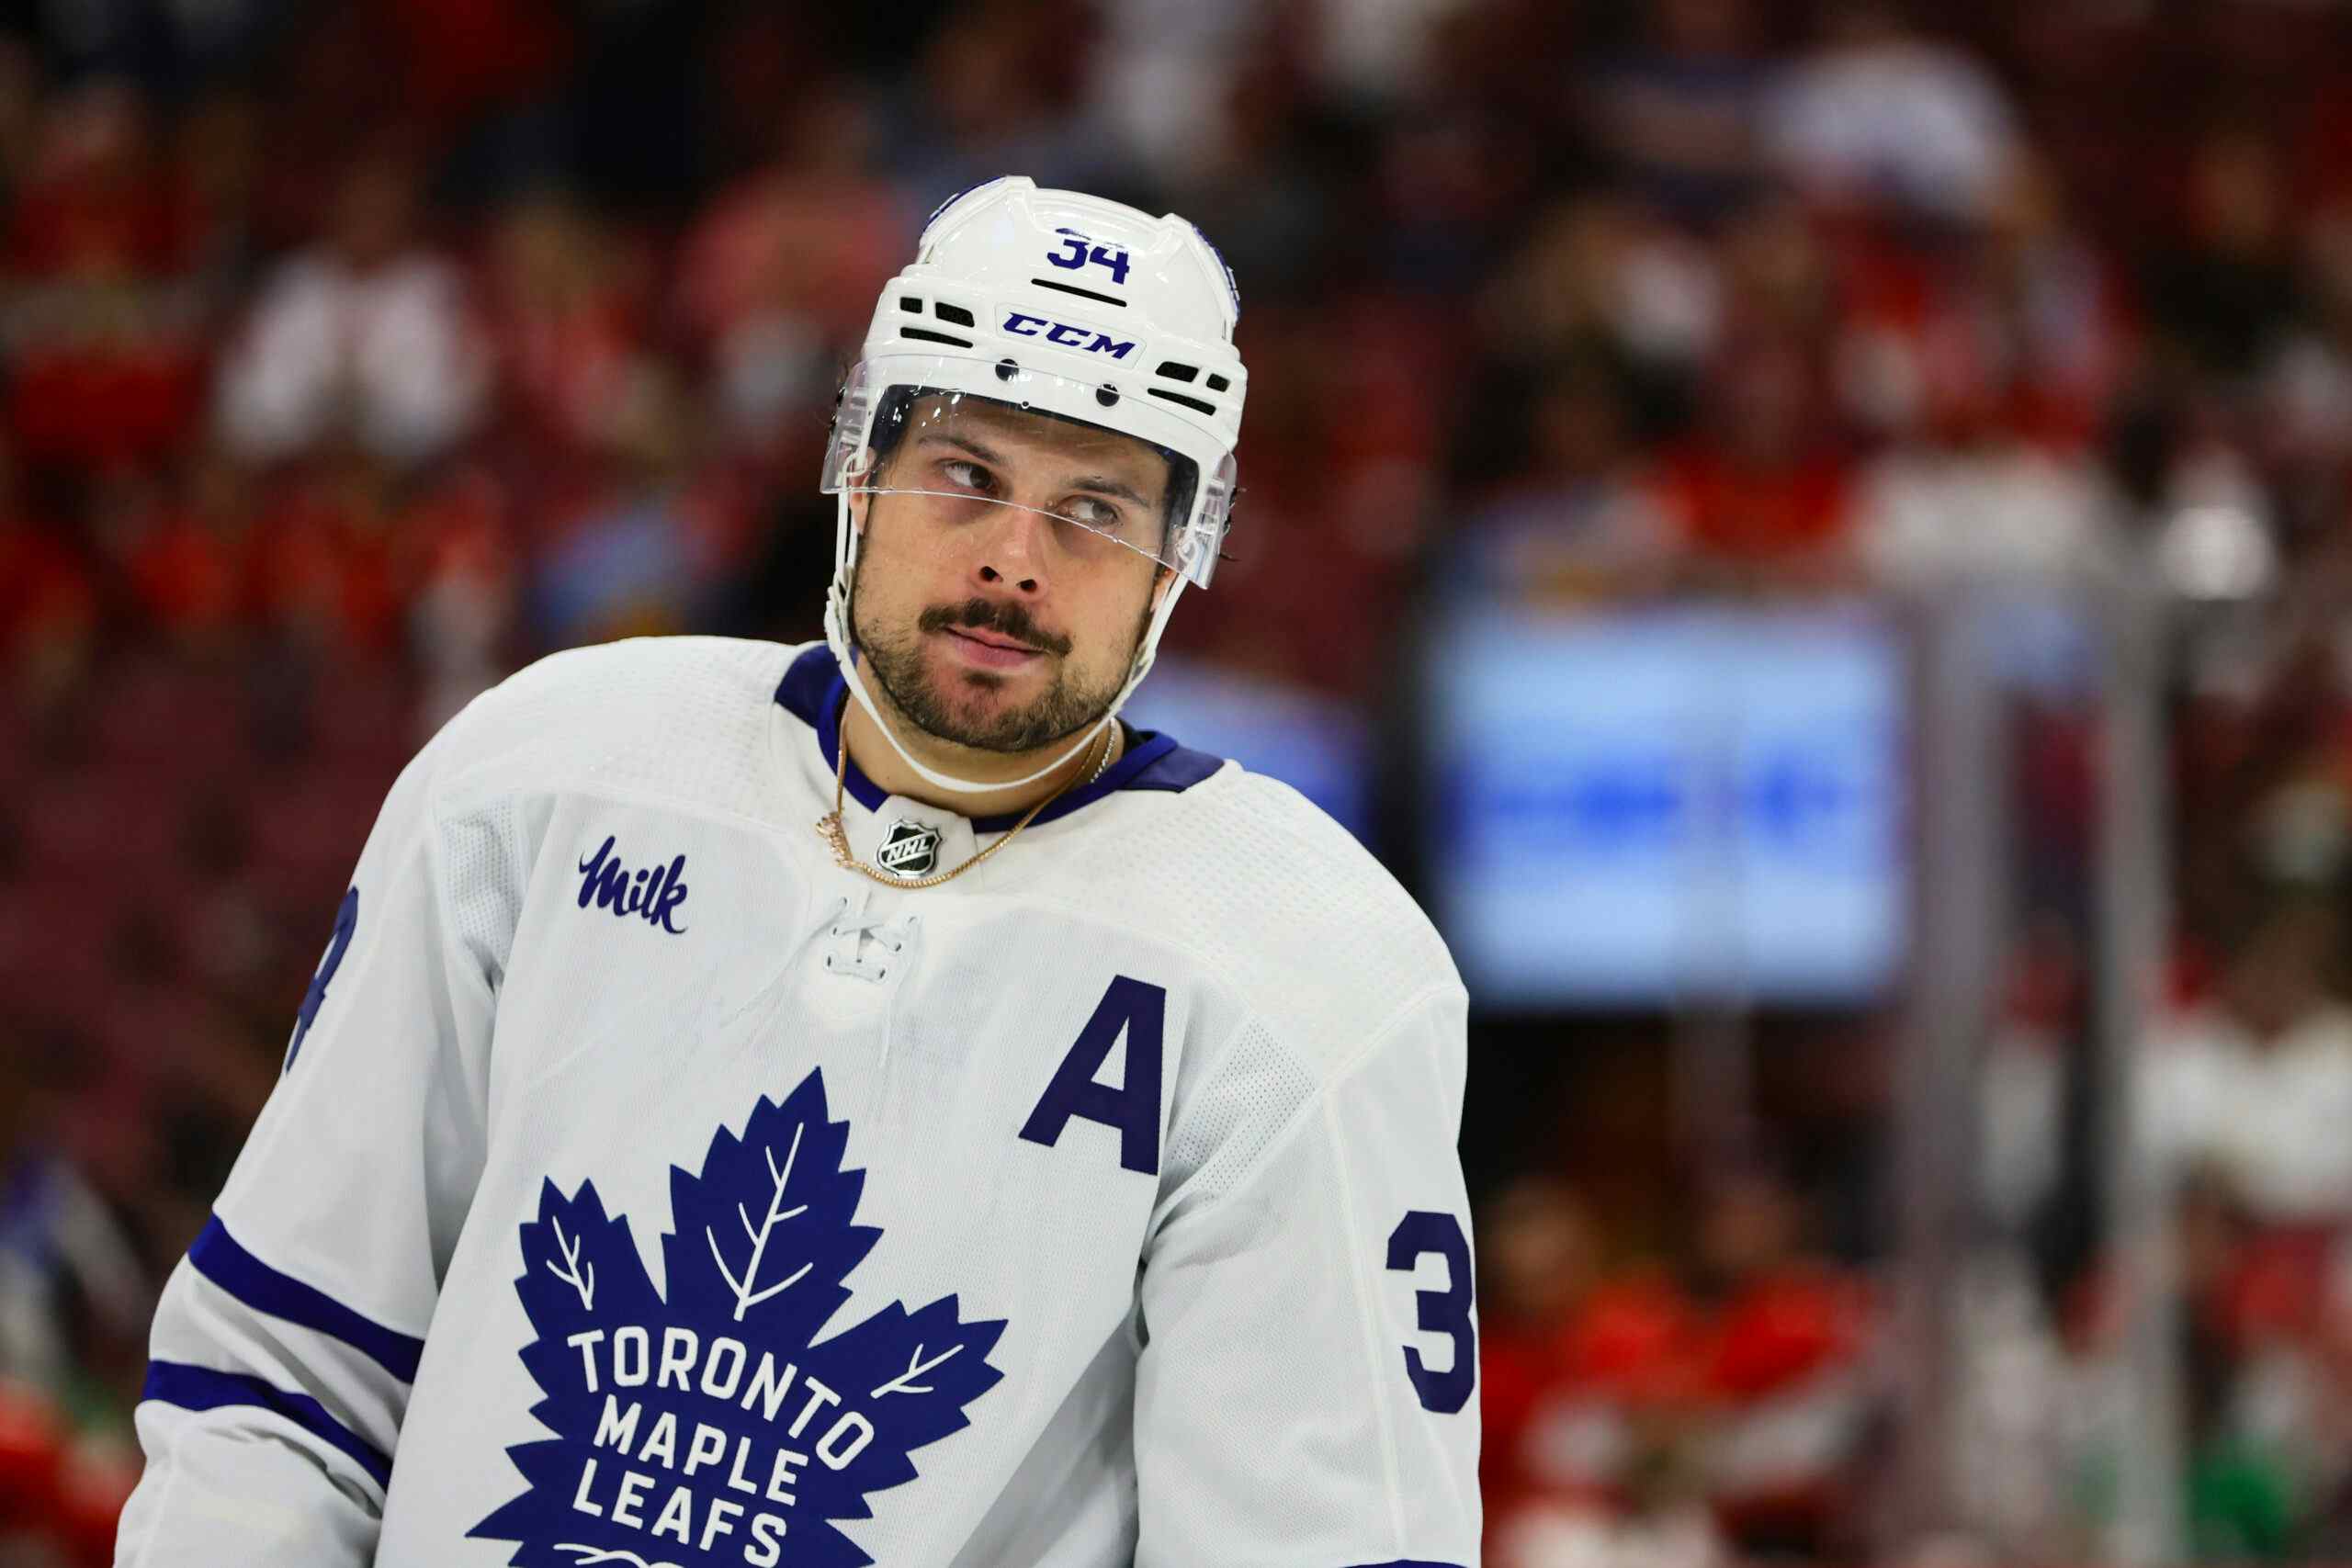
Assessing Nikolai Kulemin; Part I – Shooting and scoring
By Cam Charron
11 years ago
Unbelievably, it’s impossible to find a scathing indictment of Nikolai Kulemin to dissect and disprove, as Toronto Maple Leafs media have come to grips with the concept of “shooter regression”.
Nikolai Kulemin scored 30 goals in the 2011 NHL season, only to drop to seven in the very next year. A lot of this is due to the fact that Kulemin’s 17.3% shooting rate from a season ago just wasn’t sustainable and was bound to drop. It took quite a tumble, falling well below normal levels and landing at 6.5% on the season.
But there’s a piece of worrisome data ahead, as well as a redeeming one.
For two separate years with huge gaps in shooting percentage, judging a player on goal totals alone is intellectually dishonest. What I like to do is look at “shots per game”, and try and come up with how many goals a player would have scored with a normal shooting rate. In Kulemin’s case, his career shooting average is 12.3%:
| Shots/Game | Exp. Goals/Game | Exp. Goals/82 GP | |
|---|---|---|---|
| 2009 | 1.77 | 0.22 | 18 |
| 2010 | 1.86 | 0.23 | 19 |
| 2011 | 2.11 | 0.26 | 21 |
| 2012 | 1.53 | 0.19 | 15 |
If you look at purely shots, Kulemin’s dip isn’t as noticeable, but it’s sizeable. Part of the problem when evaluating Kulemin’s season is that he outscored his performance in 2011 so a lot of fans don’t know what to expect. In Brian Burke’s case, it makes it that much harder to evaluate him making contract talks all the more difficult.
Ah, but not every game is equal. Kulemin played two minutes more in 2011 per game than he did in 2012, averaging 17:19 in the first season and 15:13 in the next. This came out to a difference of nearly 400 total minutes, which isn’t a particularly strong excuse for losing six goals of production, but worth noting.
The addition of James Van Riemsdyk doesn’t exactly ease a logjam when it comes to minutes for Top Six wingers. You could make the argument that the Leafs now have five clear-cut Top Six wingers and there are only four spots available. Kulemin had 217:55 of powerplay time in 2011, but last year, that was reduced to 60:25.
So Kulemin’s powerplay scoring rate almost kept identical to his career average. If you suss out his 5-on-5 and his 5-on-4 scoring and shooting at Behind the Net, you get this:
| EV G/60 | EV Sh/60 | PP G/60 | PP Sh/60 | |
|---|---|---|---|---|
| 2008 | 0.89 | 7.21 | 1.03 | 11.28 |
| 2009 | 0.76 | 7.12 | 0.00 | 6.86 |
| 2011 | 1.32 | 7.40 | 1.39 | 7.23 |
| 2012 | 0.33 | 6.25 | 1.01 | 7.05 |
EVG/60 is even strength goals per 60 minutes, and EVSh/60 is even strength shots per 60 minutes. I also have powerplay numbers as well. What do you notice? Well, Kulemin’s even strength shooting rate was at its lowest ever this season, but his powerplay numbers have sort of bounced around his entire career.
His drop in goal-scoring isn’t as consistent as his drop in shooting at even strength, so there were other factors than performance at play here. Puck luck, being one of them. Look at his career shooting percentage numbers at even strength and on the powerplay:
| EV Sh% | PP Sh% | |
|---|---|---|
| 2009 | 12.4% | 9.1% |
| 2010 | 10.7% | 0.0% |
| 2011 | 17.8% | 19.2% |
| 2012 | 5.3% | 14.3% |
What are the odds that over one summer, Nikolai Kulemin suddenly forgot how to pick a corner, or decided he wasn’t going to go into dirty areas, or had resigned himself to take only long, fluttering shots from the half circle? Zero. This is a case of pucks hopping over sticks in good areas, or goalies playing his shots just a little more sharp than they had been throughout his career.
Here’s how many goals Kulemin would have scored in each year of his career with consistent shooting percentage and consistent ice time at both even strength and on the powerplay. I used 12.1% shooting at even strength and 11.6% on the powerplay, and this season’s minutes:
| EVG | PPG | Total | |
|---|---|---|---|
| 2009 | 13.1 | 1.3 | 14.4 |
| 2010 | 13.0 | 0.8 | 13.8 |
| 2011 | 13.5 | 0.8 | 14.3 |
| 2012 | 11.4 | 0.8 | 12.2 |
Pro-rated over 82 games, those totals are 16, 17, 16 and 14. That’s similar to the first chart I have in this post, but lowered to account for less powerplay time. I figure on a team with Van Riemsdyk, Kulemin’s powerplay minutes are more likely to trend lower than higher.
So Kulemin’s 23-goal drop in production is more of a 2-goal drop in actual offensive performance. It’s not the end of the world if you have a #41 jersey, but it’s something Burke ought to keep in mind in contract negotiations. Kulemin absolutely out-performed his role in 2011, and one of the worst things is appreciating that he may never get back to that level of offensive production.
Recent articles from Cam Charron


