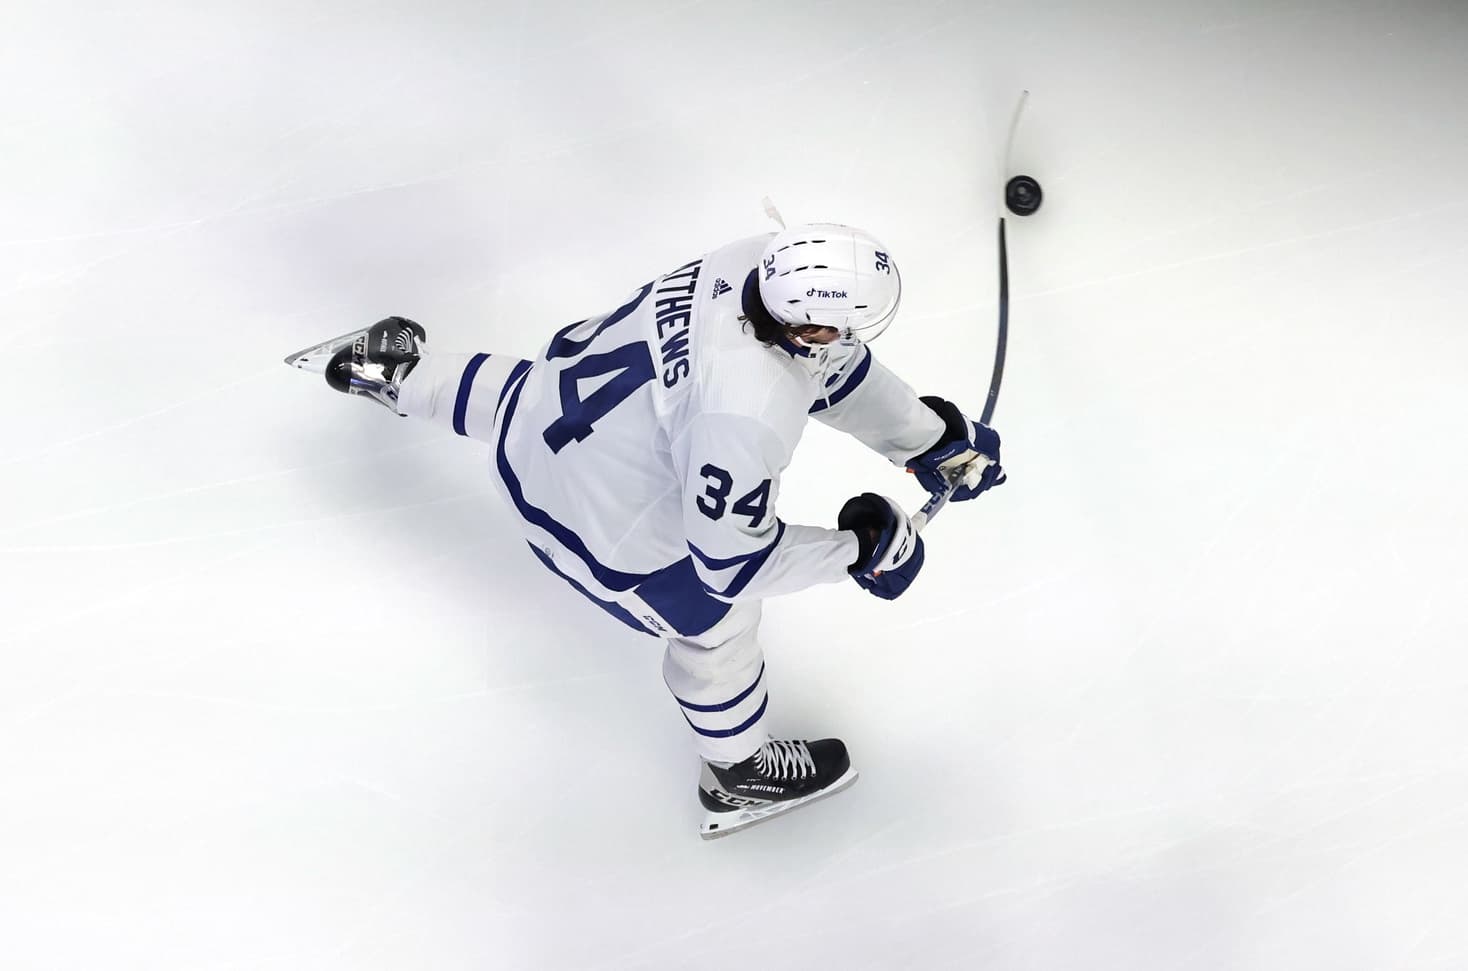
Maple Leafs shooting by the numbers

By Jon Steitzer
1 year agoIt’s 34 games into the Leafs season. Well actually it’s 35 games in, because the Leafs played the Coyotes after I wrote this, and but for the purpose of what you are about to read, 34 games have been played. With that comes some pretty established trends in regards to how things are going for the Leafs this season.
When it comes to how the Leafs have been shooting this year, they’ve been sitting at 10%, combined with their team save percentage, they have a PDO of 102.2. When it comes to how they’ve been scoring, they’ve been scoring slightly above expected. The Leafs has a G/60 of 3.35, and a xG/60 of 3.27, so they are outscoring what was expected.
Here’s the breakdown of how the individual Leaf shooters have been performing by scoring and shot metrics.
Player | Position | GP | TOI/GP | Goals/60 | ixG/60 | Goals vs. Expected/60 |
Ilya Mikheyev | R | 5 | 15.91 | 3.02 | 1.20 | 1.82 |
Auston Matthews | C | 31 | 20.68 | 2.15 | 1.47 | 0.68 |
Jason Spezza | C | 30 | 11.76 | 1.19 | 0.71 | 0.48 |
William Nylander | R | 34 | 18.86 | 1.50 | 1.16 | 0.34 |
TJ Brodie | D | 34 | 20.55 | 0.26 | 0.09 | 0.17 |
Justin Holl | D | 28 | 20.57 | 0.10 | 0.07 | 0.03 |
Morgan Rielly | D | 34 | 23.98 | 0.29 | 0.28 | 0.01 |
Alexander Kerfoot | C | 34 | 15.56 | 0.68 | 0.68 | 0.00 |
Ondrej Kase | R | 29 | 14.31 | 1.16 | 1.17 | -0.01 |
Travis Dermott | D | 23 | 14.53 | 0.18 | 0.19 | -0.01 |
David Kampf | C | 34 | 14.73 | 0.48 | 0.52 | -0.04 |
Jake Muzzin | D | 33 | 21.43 | 0.08 | 0.13 | -0.05 |
John Tavares | C | 33 | 18.52 | 1.37 | 1.45 | -0.08 |
Mitchell Marner | R | 26 | 20.78 | 0.67 | 0.80 | -0.13 |
Kyle Clifford | L | 8 | 8.31 | 0.00 | 0.18 | -0.18 |
Timothy Liljegren | D | 19 | 15.99 | 0.00 | 0.19 | -0.19 |
Rasmus Sandin | D | 29 | 16.27 | 0.00 | 0.20 | -0.20 |
Pierre Engvall | L | 32 | 13.01 | 0.58 | 0.79 | -0.21 |
Michael Bunting | L | 34 | 15.05 | 0.82 | 1.06 | -0.24 |
Wayne Simmonds | R | 33 | 9.97 | 0.73 | 1.04 | -0.31 |
Nick Ritchie | L | 32 | 12.08 | 0.31 | 0.88 | -0.57 |
When it comes to outscoring what is expected of them, it’s probably no surprise that Ilya “4 goals in 5 games” Mikheyev is leading the pack. It’s also not much of a surprise that players like Matthews and Nylander are also outperforming their expected numbers, and Brodie, well, the bar was set pretty low for him and his recent goal scoring hot streak would absolutely throw his numbers into a flux.
On the other side of things, Tavares has had some modest struggles, but that’s nothing compared to the incredibly rough year that Nick Ritchie has been facing, although when you look at Bunting, Simmonds, and Ritchie all being at the bottom of the list, it’s important to note that net front opportunities are going to have a significantly higher expected goal total.
When it comes to shooting frequency, one of the biggest surprises again has to be Ilya Mikheyev. Mikheyev seems determined to establish that he has an offensive side to his game, and he’s clearly been shooting a lot more.
Before looking at the table, here’s the breakdown of what the average shots/60 are for the Leafs and by position on the Leafs:
Average Shots per 60: 6.99
Forwards Average Shots per 60: 8.80
Defense Average Shots per 60: 3.36
Forwards Average Shots per 60: 8.80
Defense Average Shots per 60: 3.36
Player | Position | GP | TOI/GP | Shots/60 | iCF/60 | Shots on net % |
Ilya Mikheyev | R | 5 | 15.91 | 14.33 | 16.59 | 86.38 |
Auston Matthews | C | 31 | 20.68 | 12.91 | 22.74 | 56.77 |
Ondrej Kase | R | 29 | 14.31 | 11.57 | 18.51 | 62.51 |
William Nylander | R | 34 | 18.86 | 11.04 | 18.72 | 58.97 |
John Tavares | C | 33 | 18.52 | 10.11 | 16.79 | 60.21 |
Pierre Engvall | L | 32 | 13.01 | 9.23 | 15.86 | 58.20 |
Wayne Simmonds | R | 33 | 9.97 | 9.12 | 13.31 | 68.52 |
Michael Bunting | L | 34 | 15.05 | 7.97 | 14.19 | 56.17 |
Jason Spezza | C | 30 | 11.76 | 7.83 | 15.82 | 49.49 |
Nick Ritchie | L | 32 | 12.08 | 7.45 | 12.58 | 59.22 |
Mitchell Marner | R | 26 | 20.78 | 6.99 | 15.21 | 45.96 |
Morgan Rielly | D | 34 | 23.98 | 6.55 | 11.11 | 58.96 |
Alexander Kerfoot | C | 34 | 15.56 | 5.90 | 9.53 | 61.91 |
David Kampf | C | 34 | 14.73 | 4.91 | 8.27 | 59.37 |
Timothy Liljegren | D | 19 | 15.99 | 4.74 | 10.27 | 46.15 |
Jake Muzzin | D | 33 | 21.43 | 3.48 | 8.83 | 39.41 |
Travis Dermott | D | 23 | 14.53 | 3.23 | 7.00 | 46.14 |
Rasmus Sandin | D | 29 | 16.27 | 3.05 | 9.41 | 32.41 |
Kyle Clifford | L | 8 | 8.31 | 2.71 | 7.22 | 37.53 |
Justin Holl | D | 28 | 20.57 | 1.88 | 4.06 | 46.31 |
TJ Brodie | D | 34 | 20.55 | 1.72 | 5.15 | 33.40 |
So Mitch Marner is the Leafs average, but he’s been shooting less than other Leafs forwards. Not a good sign for one of the core forwards, but at this point we know what Marner is, and in fact he can almost be more frustrating when he increases his shot totals, so we need to decide we won’t from him rather than demanding that he be all things.
Despite Kerfoot’s success offensively this year, his shot totals are also fairly low, and Kampf, well, Kampf is Kampf.

Player | Position | GP | TOI/GP | SH% | SH% vs. Prv Yr | SH% vs. Career |
Ilya Mikheyev | R | 5 | 15.91 | 21.05 | 14.55 | 12.55 |
Auston Matthews | C | 31 | 20.68 | 16.67 | -1.83 | 0.47 |
Ondrej Kase | R | 29 | 14.31 | 10.00 | 10.00 | 0.60 |
William Nylander | R | 34 | 18.86 | 13.56 | 1.76 | 0.76 |
John Tavares | C | 33 | 18.52 | 13.59 | 1.89 | 0.39 |
Pierre Engvall | L | 32 | 13.01 | 6.25 | -5.25 | -3.35 |
Wayne Simmonds | R | 33 | 9.97 | 8.00 | -3.30 | -4.50 |
Michael Bunting | L | 34 | 15.05 | 10.29 | -16.01 | -5.91 |
Jason Spezza | C | 30 | 11.76 | 15.22 | 2.92 | 2.52 |
Nick Ritchie | L | 32 | 12.08 | 4.17 | -8.23 | -4.93 |
Mitchell Marner | R | 26 | 20.78 | 9.52 | -3.28 | -1.68 |
Morgan Rielly | D | 34 | 23.98 | 4.49 | -0.51 | -0.31 |
Alexander Kerfoot | C | 34 | 15.56 | 11.54 | -0.26 | -2.56 |
David Kampf | C | 34 | 14.73 | 9.76 | 8.16 | 3.06 |
Timothy Liljegren | D | 19 | 15.99 | 0.00 | 0.00 | 0.00 |
Jake Muzzin | D | 33 | 21.43 | 2.44 | -1.46 | -2.46 |
Travis Dermott | D | 23 | 14.53 | 5.56 | -0.04 | 1.16 |
Rasmus Sandin | D | 29 | 16.27 | 0.00 | 0.00 | -1.80 |
Kyle Clifford | L | 8 | 8.31 | 0.00 | -6.20 | -6.70 |
Justin Holl | D | 28 | 20.57 | 5.56 | 2.06 | 1.46 |
TJ Brodie | D | 34 | 20.55 | 15.00 | 12.90 | 8.80 |
As for their shooting percentages, Ilya Mikheyev’s heater continues to stand out in his return, and outside of Clifford, most of the other players on this list have a more meaningful data sample to look at, so take both their numbers with a grain of salt. Similarly, Michael Bunting didn’t have much of a previous history to pull from, so the difference in his results are understandable.
Ritchie’s results again standout as bad or unlucky, and while Engvall’s shooting percentage might be down, it is likely from the increased frequency in which he has been shooting, and that’s something that has generally benefited the Leafs this season.
What can we take away from all of this? Well, Ilya Mikheyev is certainly riding a wave. And the normalization of Spezza and Brodie’s numbers can be expected as well and we’re already seeing some of that with Spezza. There’s probably some incentive to ride it out with Nick Ritchie because seemingly there’s no way that he stays this bad forever, and in the case of Auston Matthews hopefully we’re seeing a 60 goal season.
With the Leafs being on a mild PDO heater, it shouldn’t be too surprising if they struggle to maintain their current 21-4-2 pace they’ve had over the last 27 games, but at the same time expecting the team to fall off significantly is a stretch as well, as the performance of the Leafs players isn’t largely out of the norm for what they are capable of.
Recent articles from Jon Steitzer